| Table of Contents | ||
|---|---|---|
|
Best Practices
Report Landscape and Terminology
In Power BI, a report can have one or more report pages and all the pages together are collectively referred to as the report. The basic elements of the report are visuals (aka visualizations), standalone images, and text boxes. From the individual data points, to the report elements, to the report page itself, there are innumerable formatting options.
...
In-depth guidance and instructions for creating and using Power BI reports is available at powerbi.com > Learn.
Report Focus: Requirements
Creating a report starts before you build your first visual because a good report needs planning. Know what data you have to work with and write down the requirements for the report. Ask yourself “What is the business need, how is this data going to be used, and by whom?” A key question is “what decisions does the reader want to be able to make based on this report?”
...
Once you’ve identified the business need, the customers, and the metrics you’d like to include, the next step is to pick the right visuals to tell the story and present those visuals in the most-effective way possible. That covers a lot of ground, and we’ll start with some basic principles of report design.
Principles of Report Design
A report page has limited space and one of the hardest things is to fit all the elements you want into that space – and still have that information be easily understood. And don’t underplay the value of “pretty.” The key is to find the balance between pretty and useful.
Let’s take a look at layout, clarity, and aesthetics.
Layout - Report Canvas
The report canvas has a finite amount of space. If you can’t fit all the elements on a single report page, break the report up into pages. A report page can be tailored to a specific audience (e.g., HR, IT, Sales, SLT), or to a specific business question (e.g., How are defects impacting our downtime?, What is our Marketing campaign’s impact on Sentiment?) or as a progressive story (e.g. first page as overview or attention-grabbing “hook”, 2nd page continues the data story, 3rd page dives deeper into the story, etc.). If your entire report fits on a single page, great. If it doesn’t, create separate report pages that logically chunk the content. And don’t forget to give the pages meaningful and helpful names.
Think about filling an art gallery. You wouldn’t put 50 pieces of artwork into a small room, fill it with chairs and paint each wall a different color. As the curator, you’d choose just pieces that have a common theme, lay them out around the room with plenty of space for visitors to move and think, and place informational cards that describes what they’re looking at. And there’s a reason most modern galleries have plain walls! For this article, we’ll start with a report example that needs a lot of work. As we apply our best practices and principles of design, our report will improve.
Alignment, order, and proximity
The layout of your report elements impacts comprehension and guides the reader through the report page. How you place and position elements tells a story. The story might be “start here and then look here” or “these 3 elements are related to each other.”
...
Let’s take a closer look at alignment.
Alignment
Alignment doesn’t mean that that the different components need to be the same size or that you must have the same number of components on each row of the report. It just means that there is a structure to the page that aids in navigation and readability. Power BI includes tools to help you align your visuals. In Power BI Desktop, with multiple visuals selected, you can use the Align and Distribute options on the Visuals ribbon tab to match up the position of visuals.
In Power BI online and Power BI Desktop, you also have precise control over the size and position of visuals through the General tab on the formatting pane for all visuals:
Fit to the space
Make the best use of the space you have. If you know how the report will be viewed/displayed, design with that in mind. Reduce empty space to fill the canvas. Do all you can to eliminate the need for scroll-bar on individual visuals. Fill the space without making the visuals seem cramped.
Adjust the page size
By reducing the page size, individual elements become larger relative to the overall page. Do this by deselecting any visuals on the page and using the Page Size tab in the formatting pane. Will your report be viewed 4:3, 16:9 or another ratio? On small screens or huge screens? Or on all possible screen ratios and sizes? Design with this in mind.
Reduce clutter
A cluttered report page will be hard to understand at-a-glance and may be so overwhelming that readers won’t even try. Get rid of all report elements that aren’t necessary. Don’t add bells-and-whistles that don’t help comprehension or navigation. Your report page needs to convey the information as clearly and quickly and cohesively as it can.
...
Here our example is already looking better. We’ve removed lots of clutter and added shapes to group elements together. The background image is gone, the unnecessary arrow shape and text box are gone, one visual has been moved to another page in the report, etc. We’ve also lengthened the page size to increase white (yellow?) space.
Tell a story at a glance
The overall test should be that somebody without any prior knowledge can quickly understand the report without any explanation from anybody. With a quick glance, readers should be able to quickly see what the page is about and what each chart/table is about.
...
Concentrate on creating a common theme or look for your report, and apply it to all pages of the report; using standalone images and other graphics to support and not detract from the real story; and applying all the best practices we discussed up to this point in the article.
Text boxes
Sometimes the titles on visualizations aren’t enough to tell the story. Add text boxes to communicate with the people viewing your reports. Text boxes can describe the report page, a grouping of visuals, or describe an individual visual. They can explain results or better-define a visual, components in the visual, or relationships between visuals. Text boxes can be used to draw attention based on different criteria called out in the text box.
In Power BI service, from the top menubar, select Text Box. (In Power BI Desktop, select Text Box from the Insert area of the ribbon.) Type in the empty box and then use the controls at the bottom to set font face, size, alignment, and more. Use the handles to resize the box, but don’t overdo it! Too much text on a report is distracting and detracting from the visuals. If you find that your report page requires a ton of text to make it understandable, then start over. Can you pick a different visual that tells a better story on its own? Can you tweak the visual’s native titles to make it more intelligible?
Text
Create a text style guide and apply it to all pages of your report. Pick just a few font faces, text sizes, and colors. Apply this style guide to not only textual elements but to the font choices you make within your visualizations (see Titles and labels that are part of the visualizations, below). Set rules for when you’ll use bold, italics, increased font size, certain colors, and more. Try to avoid using all capitalization or underlining.
Shapes
Shapes too can aid navigation and comprehension. Use shapes to group related information together, highlight important data, and use arrows to direct the eye. Shapes help readers understand where to start and how to interpret your report. In design terms, this is often referred to as contrast. Our text style guide calls for no backgrounds, black titles, legends, and labels and that was applied to all visuals on the page, where possible (the Combo chart axes and labels are not editable). Additionally: - Cards: Category label set to Off, Title turned On and set to 12pt black centered. - Visual titles: if turned On, set to 12pt and left-aligned. - Slicers: Header set to Off, Title turned On. Leave Items > Text grey and 10pt. - Scatter and column charts: black font for X and Y axes and X and Y axes titles, if used.
Color
Use color for consistency. We’ll talk more about color in Principles of visual design, below. But here we’re referring to being deliberate in your selection of color so that it doesn’t detract from your readers being able to quickly understand your report. Too many bright colors barrage the senses. This section is more what not to do with color.
Backgrounds
When setting backgrounds for report pages, choose colors that don’t overshadow the report, clash with other colors on the page, or generally hurt the eyes. Realize that some colors have inherent meaning. For example, in the US, red in a report is typically interpreted as “bad”. You are not creating a work of art, but a functional report. Choose a color that improves the readability and prominence of the report elements.
...
Add a white background to the remaining visuals on the report page. From the formatting pane, expand the Line option and set the Line Color to white and Weight to 3.
Summary - Principles of Visual Design
We’ve looked at the principles of report design; how to organize the report elements in a way that makes the report easy to quickly grasp. Now we’ll look at design principles for visuals themselves. And, in the next section, we’ll dig down into individual visuals and discuss best practices for some of the more commonly-used types.
In this section, we’re going to leave our example report page alone for a while and look at other examples. After we’ve gone through the principles of visual design, we’ll return to our example report page and apply what we’ve learned (with step-by-step instructions).
Planning – Choose the Right Visualization
Just as it’s important to plan out your report before you start building, each visual also requires planning. Ask yourself “what story am I trying to tell with this visual?” And then figure out which visual type will tell the story best. You could show progress through a sales cycle as a bar chart but wouldn’t a waterfall or funnel chart tell it better? For help with this, read the last section of this paper “Visual types and best practices” which describes best practices for some of the more-common types. Don’t be surprised if the first visual type you pick doesn’t end up being your best option. Try more than one visual type to see which one makes the point best.
...
Even when you choose the absolutely-best visual for the story, you might still need help telling the story. That’s where labels, titles, menus, color, and size come in. We’ll discuss these design elements later in the section titled “Design elements”.
Choose the Right Measure
Is the story your visual telling compelling? Does it matter? Don’t build visuals for the sake of building visuals. Maybe you thought the data would tell an interesting story, but it doesn’t. Don’t be afraid to start over and look for a more-interesting story. Or, maybe the story is there but it needs to be measured in a different way.
For example, say you want to measure the success of your sales managers. What measure would you use to do this? Would you measure that best by looking at total sales or total profit, growth over previous year or performance against a target goal? Salesperson Sally might have the largest profit, and if you showed total profit by salesperson in a bar chart, she would look like a rockstar compared to the other salespeople. But if Sally has a high cost of sales (travel expenses, shipping costs, manufacturing costs, etc.), simply looking at sales doesn’t tell the best story.
Reflect reality/don’t distort reality
It’s possible to build a visual that distorts the truth. There’s a website where data enthusiasts share “bad” visuals. And the common theme in the comments is disappointment in the company that created and distributed that visual. It sends the message that they can’t be trusted. Create visuals that don’t intentionally distort reality and that aren’t manipulated to tell the story you want them to tell.
Readers expect and often assume the X axis is starting at zero. If you decide to not start at zero, do so in a way that doesn’t distort the results and consider adding a visual cue or text box to point out the deviation from the norm.
Design elements
Once you’ve selected a type and measure and created the visual, it’s time to fine-tune the display for maximum effectiveness. This section covers: - Layout, space, and size - Text elements: labels, annotations, menus, titles - Sorting - Visual interaction - Color
Tweaking visuals for best use of space
If you’re trying to fit multiple charts into a report, maximizing your data-ink ratio will help make the story in your data stand out. As mentioned above, Edward Tufte coined ‘data-ink’ ratio: the goal is remove as many marks from a chart as possible without impairing a reader’s ability to interpret the data.
...
Select the visual to make it active. Select and hold the gripper bar at the top middle of the visual and drag the visual to its new location.
Titles and labels that are part of the visualizations
Ensure titles and labels are readable and self-explanatory. Text in titles and labels must be an optimal size with colors that stand out (such as black instead of the default grey). Remember our style guide (see "Text" above)? Limit the number of colors and sizes -- too many different font sizes and colors make the page look busy and confusing. Consider using the same font color and size for the title of all visuals on a report page and choose the same alignment for all titles on a report page.
...
Text color can be adjusted for titles, axes, and data labels.
Titles and labels that are not part of the visualizations
Earlier in this paper we discussed adding text boxes to report pages. Sometimes the titles on visualizations aren’t enough to tell the story. Add text boxes to communicate additional information to the readers of your reports.
To keep your report page from looking too confusing or too busy, be consistent in your use of text box fonts, sizes, colors, and alignment. To make an adjustment to the text in a text box, select the text box to reveal the formatting menu.
Sorting
A really simple opportunity to provide faster insight is to set the sorting of visuals. For example, sorting bar charts in descending or ascending order based on the value in the bars enables you to quickly show significant incremental information without using more real estate.
To sort a chart, select the ellipses (…) in the top right of the chart, select Sort and choose the field you want to sort by and the direction. For more information, see Change how a visual is sorted.
Chart interaction and interplay
One of the most compelling feature of Power BI is the ability to edit the way charts interact with each other. By default, charts are cross-highlighted: when you select a data point, the related data of other charts light up and the unrelated data dims. You can override this behavior to use any chart as a true filter which saves you real estate on your page. To do this, select Visual Interactions from the menu-bar.
...
Tip
For readers who’re new to Power BI, this ability to click and interact with reports may not be instantly obvious. Add text boxes to help them understand what they can click on to find more insights.
The use of color in visuals
Earlier in this paper we talked about the importance of having a plan for how you’re going to use color across a report. This section will have some overlap but primarily applies to how you use color in individual visuals. And the same principles apply: use color to tie the report together, add emphasis to important data, and to improve the reader’s comprehension of the visual. Too many different colors is distracting and makes it difficult for the reader to know where to look. Don’t sacrifice comprehension for beauty. Only add color if it improves comprehension.
...
For fields that do have some inherent order and numerical value, you can also color data points by the value. This can be helpful to show the spread of values across the data, and also allow for two variables to be shown on a single chart. Color can also be used to emphasize variance around a central value. For example, coloring positive values green and negative values red. Be aware of cultural differences when assigning colors to positive or negative values; not all cultures use red for bad and green for good!
Visual types and best practices
Power BI provides many visual types natively. To these, add the custom visuals available from Microsoft and from the Power BI community and total visual options become too numerous to document here. But let’s look at some of the most-used native visual types. Line charts are a powerful way to look at data over time. Looking at data in tables doesn’t really take advantage of the speed in which our eyes spot peaks, valleys, cycles, and patterns.
Best practices
When people look at line charts, the first thing they see is the shape of the curve. This means that you need to have an x-axis that makes the curve meaningful such a time or distribution categories. If you put categorical fields like product or geography on the x-axis, the line chart will not be interesting as the shape of the curve would provide no meaningful information.
If you choose to place multiple charts above and below each other like this, to make it easier to compare across series, line up the X-axis. Use filters to make sure that the same range of values is shown. For example, if you’re looking at date ranges, ensure they are the same date ranges. For example, 1896 to 2012 on both charts.
Make full use of the space. If it makes sense for your data, set the start and end points for the Y-axis to eliminate empty space at the top and bottom of your chart and to focus in on the actual data points. To do this, select the paint roller icon to open the Formatting pane. Expand the Y-Axis area and set the Start and End points.
Another reason to explicitly set the Start and End points is if you’re comparing two or more charts on the same page using the same Y-axis field. For example, if you’re looking at cumulative event counts, and the United Kingdom has counts that range from 1 to 70 and Australia has counts that range from 1 to 12, the 2 line charts will display very different Y-axes (Figure x). This makes it difficult to compare at a glance. Instead, set the charts to use the same Y-axis range (Figure x).
...
Bar/Column Charts
If line charts are the standard for looking at data over time, bar charts are the standard for looking at a specific value across different categories. If you sort the bars based on the number, you will instantly see the top values and distribution. Horizontal bar charts work well with long-ish labels.
Best practices
- Display data labels for values. This makes it easier to identify specific values. To do this, open the Formatting pane, and set Data labels to On.
...
Stacked Bar/Column Charts
Add another dimension to your bar/column charts by stacking different categories within the bar or column. Now the chart conveys information about one overall trend (based on height/length) but also shows the influence of the categories on that trend.
Best practices
As with columns/bars, you have the option of horizontal or vertical display. Horizontal is a better choice if you have long labels and vertical if you have time series data.
Avoid stacked Bar/Column charts if you want to show trends and other patterns of change over time. Other charts, like Line charts, do a much better job.
You can also have the distribution based on total volume or as a % of total.
As Few noted it is difficult to compare the segments of a stacked bar. If the segments were arranged side-by-side and all grew upwards from the same baseline, it would be easy to compare their heights, but when stacked upon one another, the task becomes hard. Plus, although it’s fairly easy to see how (revenue) changed from month to month it is quite difficult to see how (revenue) in the other (categories) changed.
100% Stacked charts are a good choice when using percentages that add up to 100. In the example below, we see the category distribution by team. The percentages are relative and allows us to, at a glance, see patterns. For example, Everton’s revenue comes primarily from Broadcasting (over 70%) while PSG only derives 20% of its revenue from Broadcasting. The choice of a horizontal display makes it easier to fit the team labels and to see the impact of revenue type.
...
Combo Bar/Column Charts
In Power BI, you can combine column and line charts into a combo chart. The choices are: Line and Stacked Column chart and Line and Clustered Column chart. Save valuable canvas space by combining two separate visuals into one.
...
The new report page has a single visual: a line and stacked column chart. We could’ve just as easily created a line and clustered column chart. It’s now easier to look for a relationship between the two trends. We can see that up until 2008, population and GDP followed a similar trend. But starting in 2009, as population growth flattened, GDP was more volatile.
Best practices
Combo charts work best when both visuals have at least one axis in common.
...
Scatter Chart
Sometimes we have many variables that we want to see together, and a scatter chart can be a very useful way to get an overall picture. Scatter charts display relationships between 2 (Scatter) or 3 (Bubble) quantitative measures. A scatter chart always has two value axes to show one set of numerical data along a horizontal axis and another set of numerical values along a vertical axis. The chart displays points at the intersection of an x and y numerical value, combining these values into single data points. These data points may be distributed evenly or unevenly across the horizontal axis, depending on the data.
...
If you add a play axis, you can pretend you are Hans Rosling and tell the story over time (https://www.youtube.com/watch?v=PbaDBJWCeD4). To add a play axis, drag a datetime field into the Play Axis well.
Best practices
Scatter and Bubble charts are great storytellers. But they are not as useful when trying to explore data. This is what Stephen Few points out in the paragraph below:
The strength of this approach is when it’s used to tell a story. When Rosling narrates what’s happening in the chart as the bubbles move around and change in value, pointing to what he wants us to see, the information comes alive. Animated bubble charts, however, are much less effective for exploring and making sense of data on our own. I doubt that Rosling uses this method to discover the stories, but only to tell them once they’re known. We can’t attend more than one bubble at once as they’re moving around, so we’re forced to run the animation over and over to try to get a sense of what’s going on. We can add trails to selected bubbles, which make it possible to review the full path these bubble have taken, but if trails are used for more than a few bubbles the chart will quickly become too cluttered. Essentially, what I’m pointing out is that this is not the best way to display this information for exploration and analysis.
Add X and Y axes labels to help tell the story. Especially with bubble charts, there are many components at play and labels help readers understand the visual.
Add data labels to make the visual easier to interpret. Especially with bubble charts, when you have many items in the Legend, it may be difficult to distinguish between similar colors. In the visual above, the legend colors for Suriname, Columbia, and Ecuador are very similar.
Did you create a scatter chart and see only one data point that aggregates all the values on the X and Y axes? Or, your chart aggregates all the values along a single horizontal or vertical line? To fix this, add a field to the Details area to tell Power BI how to group the values. The field must be unique for each point you want to plot. For help, refer to the Power BI scatter and bubble chart tutorial.
Tree Map Charts
Tree maps can be very useful for giving a good overview of the relative size of different components that make up a whole -- especially when you can group them by categories. Any time I try to understand a new business, having a tree map of the main components can be very useful in knowing the overall distribution.
...
Other charts
Pie or Donut Charts
In general, bar/column/line charts will serve most purposes. It’s well understood that pie and donut charts are difficult for humans to interpret correctly, and in fact can often distort data. Avoid them where possible. Stephen Few has an excellent write up on the history and dangers in Save the Pies for Dessert
...
Or read an opposing point of view, Why Tufte is flat-out wrong about pie charts
Radial Gauges & KPIs
Radial gauges seem like a good visual for indicating performance against a target, and they are very popular in executive dashboards. However, they suffer in two main ways. As with pie charts, it’s difficult to interpret the angle of the shaded area compared to the full 180 degree arc or target line. It also uses a lot of space to show a single metric.
KPIs show the value, status, goal, variance from the goal and trend in the same amount of space. The green coloring turns red if the target isn’t being met and can be yellow if some intermediate target is hit. It’s much simpler to read and interpret than the gauge.
Removing Visual Header for Non Visuals
Recently we have noticed after designing more in-depth reports with multiple drills and hierarchies that these drill options will overlap with other drill options and graphic options (even lines in Power BI can have options). So we have started removing the Visual Header from all non related graphics on reports.
- When a non interactive visual is added to the report, for example a logo.

- You see on the right of the page a section called "Format Image" or "Format Shape"

- At the very bottom you see the option for the Visual Header.

- Simply make sure the Option is turned Off.

Query Editor
- Query name should not have spaces
- Avoid spaces when naming Columns and Measures
Security
Managed Roles
To define security roles, you can do the following.
...
You cannot assign users to a role within Power BI Desktop. This is done within the Power BI service. You can enable dynamic security within Power BI Desktop by making use of the username() or userprincipalname() DAX functions and having the proper relationships configured.
Power BI RLS Process
To learn how to use the technique of the Power BI RLS Process we must explain briefly the Role Managing. Start following these steps:
...
Manage security on your model
To manage security on your data model, you will want to do the following.
...
You can only create or modify roles within Power BI Desktop.
Working with membersAdd members
You can add a member to the role by typing in the email address, or name, of the user, security group or distribution list you want to add. This member has to be within your organization. You cannot add Groups created within Power BI.
You can also see how many members are part of the role by the number in parenthesis next to the role name, or next to Members.
Remove members
You can remove members by selecting the X next to their name.
...
• Jane did customize the content pack. The next time she opens the dashboard all tiles from the original content pack are gone, but tiles she pinned from other reports still appear. The associated reports and dataset are no longer available (and don't appear in her left navigation pane).
Data security
All distribution group members have the same permissions to the data as the content pack creator. The one exception to this is SQL Server Analysis Services (SSAS) on-premises tabular datasets. Because the reports and dashboards are connecting live to the on-premises SSAS model, the credentials of each individual distribution group member are used to determine the data he or she can access.
Creating APP for Shared Content SecurityApp workspaces
App workspaces are the places where you create apps, so to create an app, you first need to create the app workspace. If you’ve ever worked in a group workspace in Power BI, then app workspaces will be familiar. They’re the evolution of group workspaces – staging areas and containers for the content in the app.
...
After workspaces have been created in O365, it will appear in the app in Power BI, too.

Distribute an app
When you’ve finished creating and perfecting the dashboards and reports in your app workspace, you package it all up as an app and distribute it.
- In the workspace, select the Publish app button in the upper right to start the process of sharing all the content in that workspace.

- First, on Details, fill in the description to help people find the app. You can set a background color to personalize it.

- Next, on Content, you see the content that’s going to be published as part of the app – everything that’s in that workspace. You can also set the landing page – the dashboard or report people will see first when they go to your app. You can choose None. Then they’ll land on a list of all the content in the app

- Last, on Access, decide who has access to the app: either everyone in your organization, or specific people or email distribution lists.

- When you select Finish, you see a message confirming it’s ready to publish.
- In the success dialog box, you can copy the URL that’s a direct link to this app and send it to the people you’ve shared it with.

The business users that you've distributed the app to can find it in two different ways. You can send them the direct link to the app, or they can search for it in Microsoft AppSource, where they see all the apps that they can access. Either way, after that whenever they go to Apps, they’ll see this app in their list.
Change your published app
After you publish your app, you may want to change or update it. You notice that when you open your app from Apps, even though you’re the one who published it, you can’t edit it – Edit Report is grayed out.
...
- Open the app workspace that corresponds to the app.

Open the dashboard or the report. You see that you can make any changes you want.
The app workspace is your staging area, so your changes aren't pushed live to the app until you publish again. This lets you make changes without affecting the published apps.
- Go back to the app workspace list of contents and select Update app.

- Update Details, Content, and Access, if you need to, then select Update app.

The people you’ve distributed the app to automatically see the updated version of the app.
Unpublish an app
Any member of an app workspace can unpublish the app.
...
This action uninstalls the app for everyone you've distributed it to, and they no longer have access to it. It doesn't delete the app workspace or its contents.
Annotate & share a tile, report, or visual in the mobile apps
Applies to:
| iPhones | iPads | Android phones | Android tablets |
...
You can share a tile from the Power BI mobile app for Windows 10 devices, too, but not annotate it.
Open a tile for annotating
Tap the tile to open it in focus mode.
Tap the annotate icon
 in the upper-right corner of the tile.
You're ready to annotate and share the tile.
Open a report for annotating
Open a report.
Tap the annotate icon
in the upper-right corner of the report.You're ready to annotate and share the report.
Open a visual for annotating
In a report, tap a visual, then tap the expand icon to open it in focus mode.

Tap the annotate icon
in the upper-right corner of the visual.You're ready to annotate and share the visual.
Annotate and share the tile, report, or visual
Here's how you annotate:

The annotation bar in iPhones and iPads

The annotation bar in Android devices
- To draw lines of different colors and thicknesses, tap the squiggly-line icon, choose a width and color, and draw.
- To type comments, tap the AA, choose the text size and color, and type.
- To paste stamps (like emoticons) on the tile, tap the smiley face, choose a color, and tap where you want them.
After annotating, tap Share in the upper-right corner.
Open your mail app, type the recipients' names, and modify the message, if you want.
The mail has an image, and a link to the specific tile, report, or visual.
Tap Send.
Publish from Power BI Desktop
When you publish a Power BI Desktop file to the Power BI service, the data in the model and any reports you created in Report view are published to your Power BI workspace. You’ll see a new dataset with the same name, and any reports in your Workspace navigator.
...
Any changes you make to the report in Power BI, for example, add, delete, or change visualizations in reports, will not be saved back to the original Power BI Desktop file.
To publish a Power BI Desktop dataset and reports
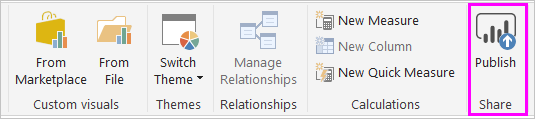
In Power BI Desktop select File > Publish > Publish to Power BI or click Publish on the ribbon.
Sign in to Power BI.
Select the destination.

When complete, you receive a link to your report. Click the link to open the report in your Power BI site.

Re-publish or replace a dataset published from Power BI Desktop
When you publish a Power BI Desktop file, the dataset and any reports you created in Power BI Desktop are uploaded to your Power BI site. When you re-publish your Power BI Desktop file, the dataset in your Power BI site will be replaced with the updated dataset from the Power BI Desktop file.
...
- If you already have two or more datasets in Power BI with the same name as the Power BI Desktop file, publish could fail. Make sure you have only one dataset in Power BI with the same name. You can also rename the file and publish, creating a new dataset with same name as the file.
- If you rename or delete a column or measure, any visualizations you already have in Power BI with that field could be broken.
- Power BI ignores some format changes of existing columns. For example, if you change a column’s format from 0.25 to 25%.
- If you have a refresh schedule configured for your existing dataset in Power BI and you add new data sources to your file and then re-publish, you’ll have to sign into them in Manage Data Sources prior to the next scheduled refresh.
- When you republish a dataset published from Power BI Desktop and have a refresh schedule defined, a dataset refresh is initiated as soon as you republish.
Future Plans
Power BI Apps FAQHow are app workspaces different from group workspaces?
With this release, we have renamed all group workspaces to app workspaces. You can publish an app from any of these workspaces. The functionality remains on par with group workspaces for the most part. Over the next few months, we plan on the following enhancements to app workspaces:
- Creating app workspaces won't create corresponding entities in Office 365 like group workspaces do. So you can create any number of app workspaces without worrying about different Office 365 groups being created behind the scenes (you can still use an Office 365 group’s OneDrive for Business to store your files).
- Today you can add only individuals to the members and admin lists. Soon you'll be able to add multiple AD security groups or modern groups to these lists to allow for easier management.
How are apps different from organizational content packs?
Apps are an evolution and simplification of content packs, with a few major differences.
- After business users install a content pack, it loses its grouped identity: it's just a list of dashboards and reports interspersed with other dashboards and reports. Apps, on the other hand, maintain their grouping and identity even after installation. This makes it easy for business users to continue to navigate to them over time.
- You can create multiple content packs from any workspace, but an app has a 1:1 relationship with its workspace. We believe this makes apps easier to understand and maintain over the long run. See the roadmap section of the Power BI blog for more on how we plan to improve this area.
- Over time we plan to deprecate organizational content packs, so we recommend you create apps from now on.
What about read-only members in groups?
In groups, you can add read-only members who can only view the content. The main problem with this approach was that you couldn't add security groups as members. With apps, you can publish a read-only version of your app workspace to large audiences, including security groups. You can stage your changes to the dashboards and reports in the app without affecting end users. We recommend that you use apps in this way in the future. Over the long run, we plan to deprecate read-only members of workspaces as well.
...