Power BI is a business analytics service that provides interactive visualization and business intelligence capabilities that allow end users to create reports and dashboards. Data is used from sources such as; GEMS, FAST, and Banner to create reports that allow insight into making business decisions. The University of South Florida utilizes this information to make important decisions regarding COVID-19 and the management of the pandemic. Other example projects include Travel, MCOM Curriculum Mapping, COPH FIS Evaluation Reporting, and Demographics.
Accessing Power BI
- Go to http://app.powerbi.com
- Enter your USF email address. This is your Net ID + @usf.edu as an employee.
- Click the Next button.
You will be redirected to a USF site to enter your password. See Figure 1 below. - Enter your Net ID password.
- Click the Sign In button.
The Power BI system will load.

Figure 1: USF Sign on Page
Searching for a Report
There are three ways to find a report or dashboard in Power BI
Search:
- Click the Search box in the top right corner of the page.
- Type keywords found in either the report or dashboard title.
- A list will populate of possible options.
- Click on the report to open.

Shared with me:
If someone has shared a report or dashboard with you, you can always find it in the Shared with me section.
- Click on "Shared with me" on the left side of your screen.
- A list will automatically populate if you have shared reports or dashboards.
- Click to open.
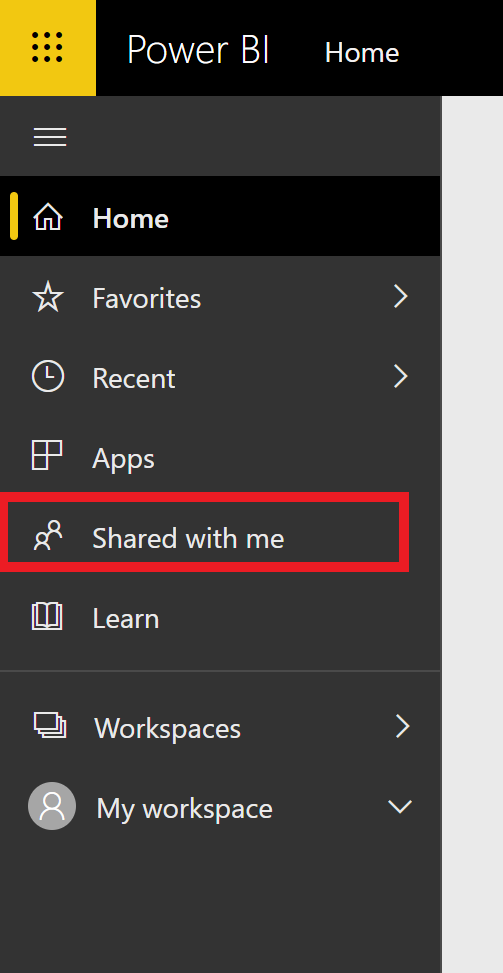
You can filter the reports in this area by choosing the Workspace or person who shared the report with you.
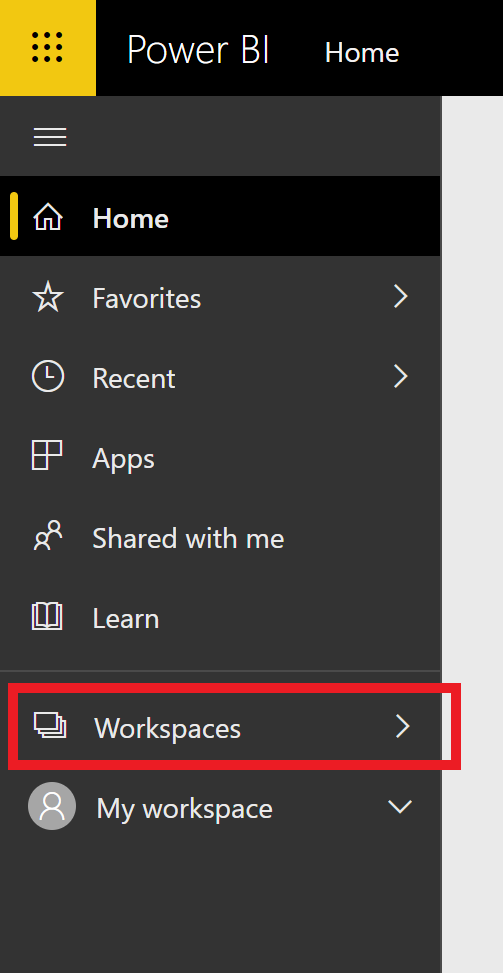
Workspaces:
These spaces give access to specific dashboards and reports. You will have a workspace for most of your Teams.
- Click on "Workspace" to see your list.
- A list will automatically populate.
- Click on the report or dashboard you want to open.