Data Filters - Data and Analytics
Filter Bar
You can use the filter bar on any report to customize your view of the data already returned based on the prompt answers you selected.
Enabling the Filter Bar
If a report was built with the filter bar enabled, you can skip this step. After running the report:
- Click Filter Bar on the top toolbar.
- The Filter Bar will display under the top toolbar. See Figure 1.
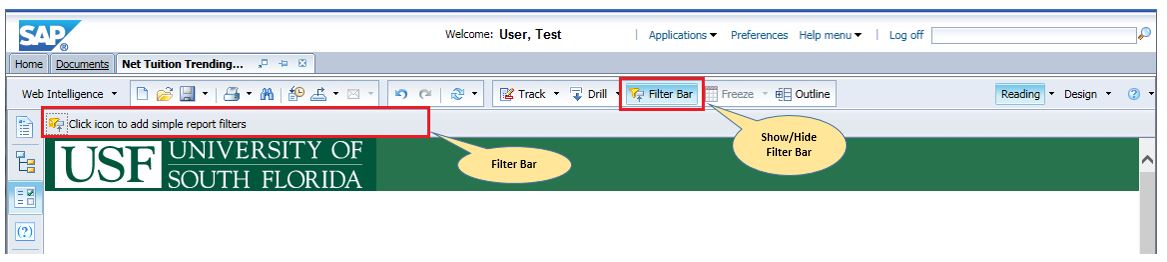
Figure 1: Filter Bar. Click image to enlarge.
Adding Objects to the Filter Bar
- Click the
 Filter Bar icon for a list of objects the can be filtered.
 - Navigate through the grouping sections with an arrow. See Figure 2.
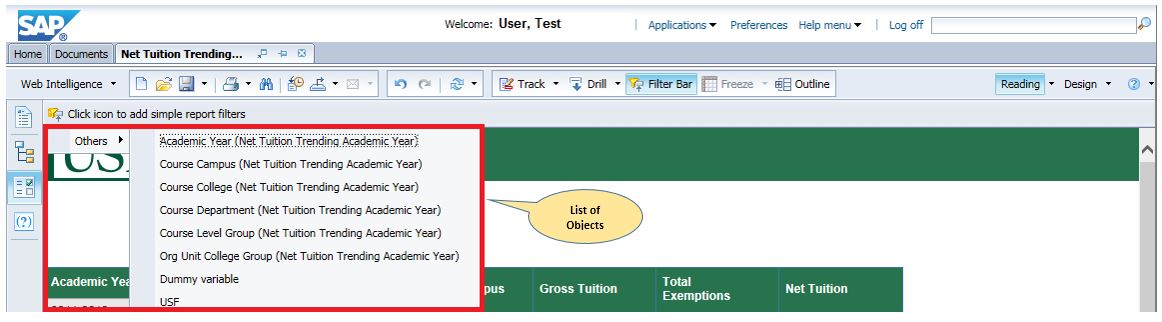
Figure 2: List of Object Filters. Click image to enlarge. Select the object you want to filter.
A drop-down box of the object values will appear on the bar, but the data on the report hasn't been filtered yet.
Multiple Objects
You may add as many objects into the filter bar as needed.
Selecting Values for the Object in the Filter Bar
- Click on the object's drop-down in the Filter Bar.
- Choose a value from the list. See Figure 3.
The page will automatically refresh and display data based on the value selected.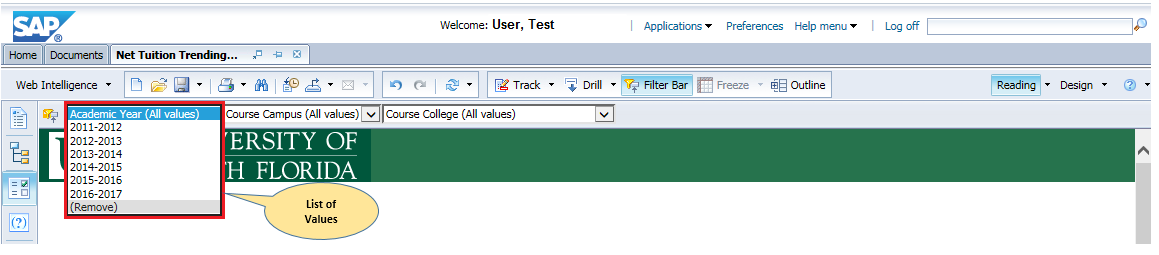
Figure 3: Object Values. Click image to enlarge.
Showing All Values
Removing Objects from the Filter Bar
Click on the object's drop-down in the Filter Bar.
Choose (Remove) from the value list. See Figure 3.
The drop-down for the object will disappear from the Filter Bar.
Input Controls
Input controls are only available on reports where they were included during the design phase. Input controls are another way to filter the data you see on a report or within a document based on the prompt answers you selected.
Opening the Input Controls
If your Input Controls toolbar is already expanded, you can skip this step.
- Click on the
 Input Controls icon on the left-hand toolbar.
 - The Input Controls details specific to your document and report will expand. See Figure 4.
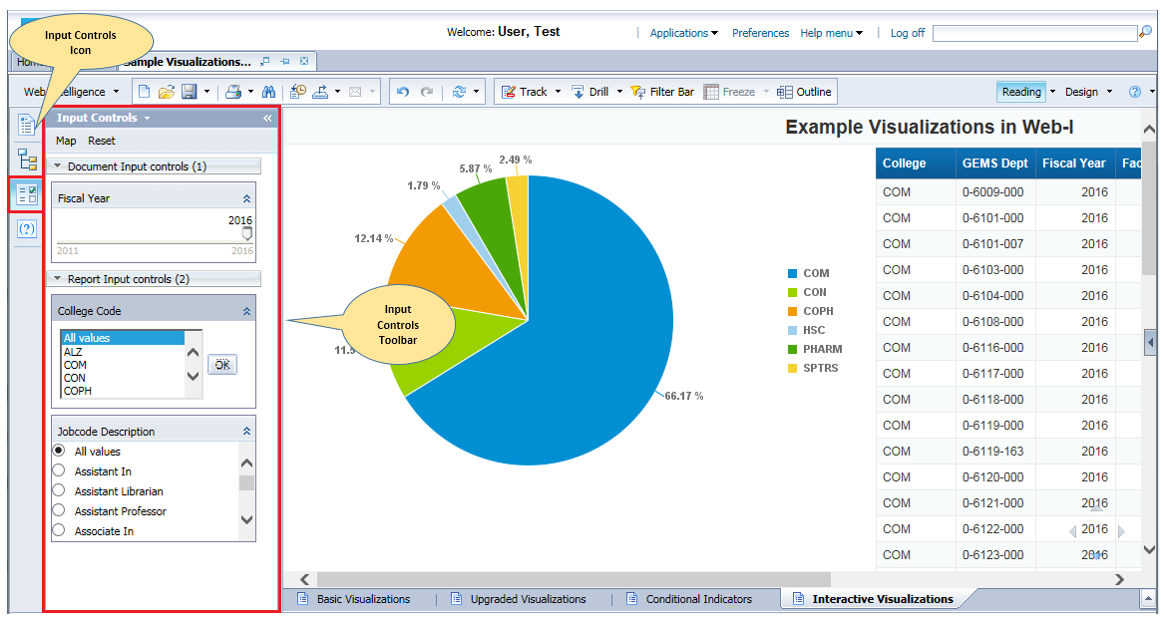
Figure 4: Input Controls Details. Click image to enlarge.
Using Input Controls
There are various types of input controls. You will need to interact differently with each control. See Figure 4 for examples.
Controls can affect different portions of the report:
- Document Input Controls - Choosing a value on these input controls will filter all tabs in the document.
- Report Input Controls - Choosing a value on these input controls will filter data on only the current tab or select elements in this tab.
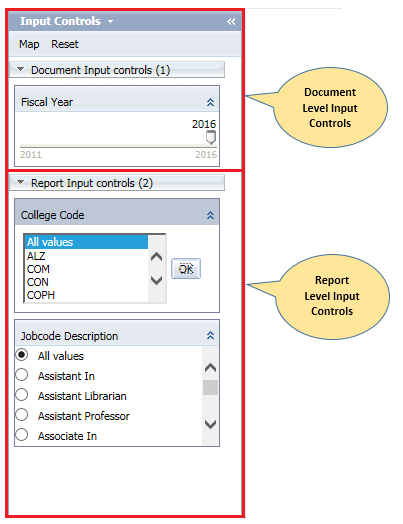
Figure 5: Different scope of Input Controls. Click image to enlarge.
Multiple Input Controls
You can use multiple input controls together to further refine the data you are viewing.
Clearing Input Controls
You can choose to clear individual Input Controls or all Input Controls.
- Individual Input Controls - Click the
 Clear Filters button or select All Values from the Input Controls values list.
 - All Input Controls - Click the
 Reset button at the top of the Input Controls detail panel. This will either set the control to it's default state or clear it.
Interactive Filters
Interactive Filters are only available on reports where they were included during the design phase. Interactive Filters are the third way to filter the data you see on a report or within a document based on the prompt answers you selected.
Identifying Interactive Filters
- The Interactive icon
 appears to the upper right of those elements of a report that can be used to filter or adjust other elements of that report.
 - To determine which elements are controlled by that Interactive Filter:
- Click on the Input Controls icon on the left-hand toolbar. If your Input Controls toolbar is already expanded, you can skip this step.
- Click on the
 Map button at the top left corner.
 - A list of Input Controls and the affected reporting elements are presented, with the current report items expanded for viewing.
- Click on the
Using Interactive Filters
The main difference between Interactive Filters and traditional Input Controls is that you are able to click on items in the report to add filters instead of opening the Input Controls toolbar. Interactive Filters are powerful and can be used in different manners. Each report will use Interactive Filters differently.
Interactive filters are not available when Drill is enabled. The Interactive Icon will not appear on elements with interactivity available when drill is enabled.
Enabling/Disabling Drill in a Report (tab)
Even if Drill is not enabled when a Document is opened, drill may still be available. To enable Drill on a given report (tab):
- Click Drill on the top toolbar.
- The Filter Bar will appear under the top toolbar and Drill Up Icon
 will display in the body of the report.
To disable drill, click on Drill on the top toolbar.
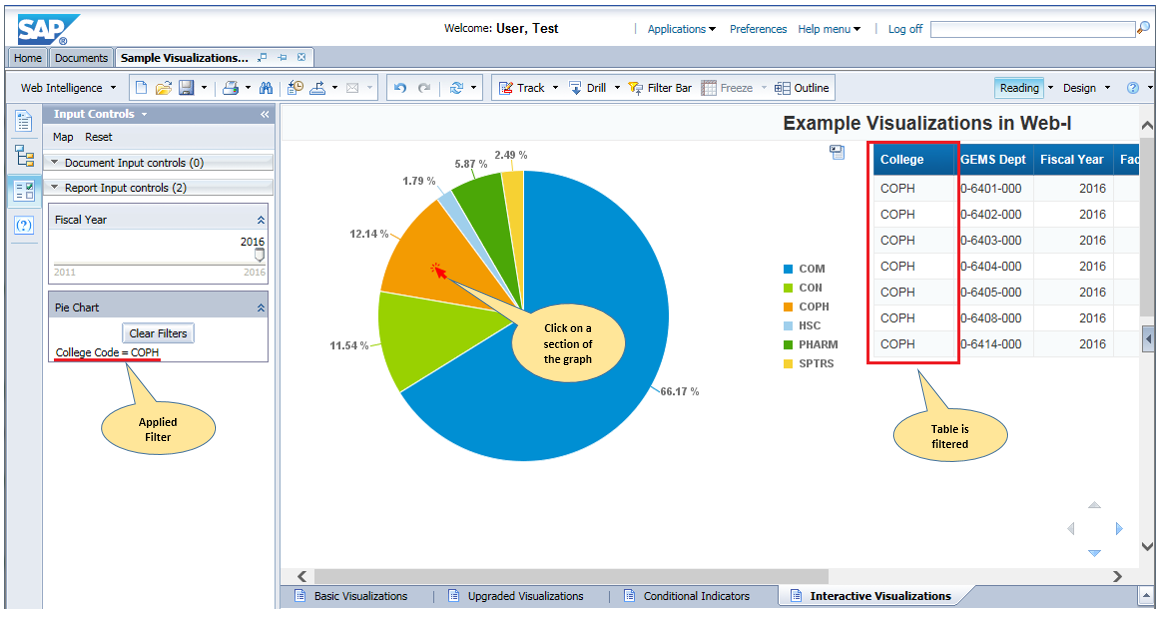
Figure 6: Interactivity Examples. Click image to enlarge.
Clearing Interactive Filters
Since Interactive Filters create Input Controls, you proceed similarly to clearing individual Input Controls or all Input Controls.
- Individual Input Controls - Click the Clear Filters button or select All Values from the Input Controls values list.
- All Input Controls - Click the Reset button at the top of the Input Controls detail panel. This will either set the control to it's default state or clear it.