Accessing Power BI
| Anchor | ||||
|---|---|---|---|---|
|
- Go to http://app.powerbi.com
- Click Sign In under "Already have an account?"
- Enter your USF email address on the Sign In screen. This is your Net ID + @usf.edu as an employee.
Click the Next button.
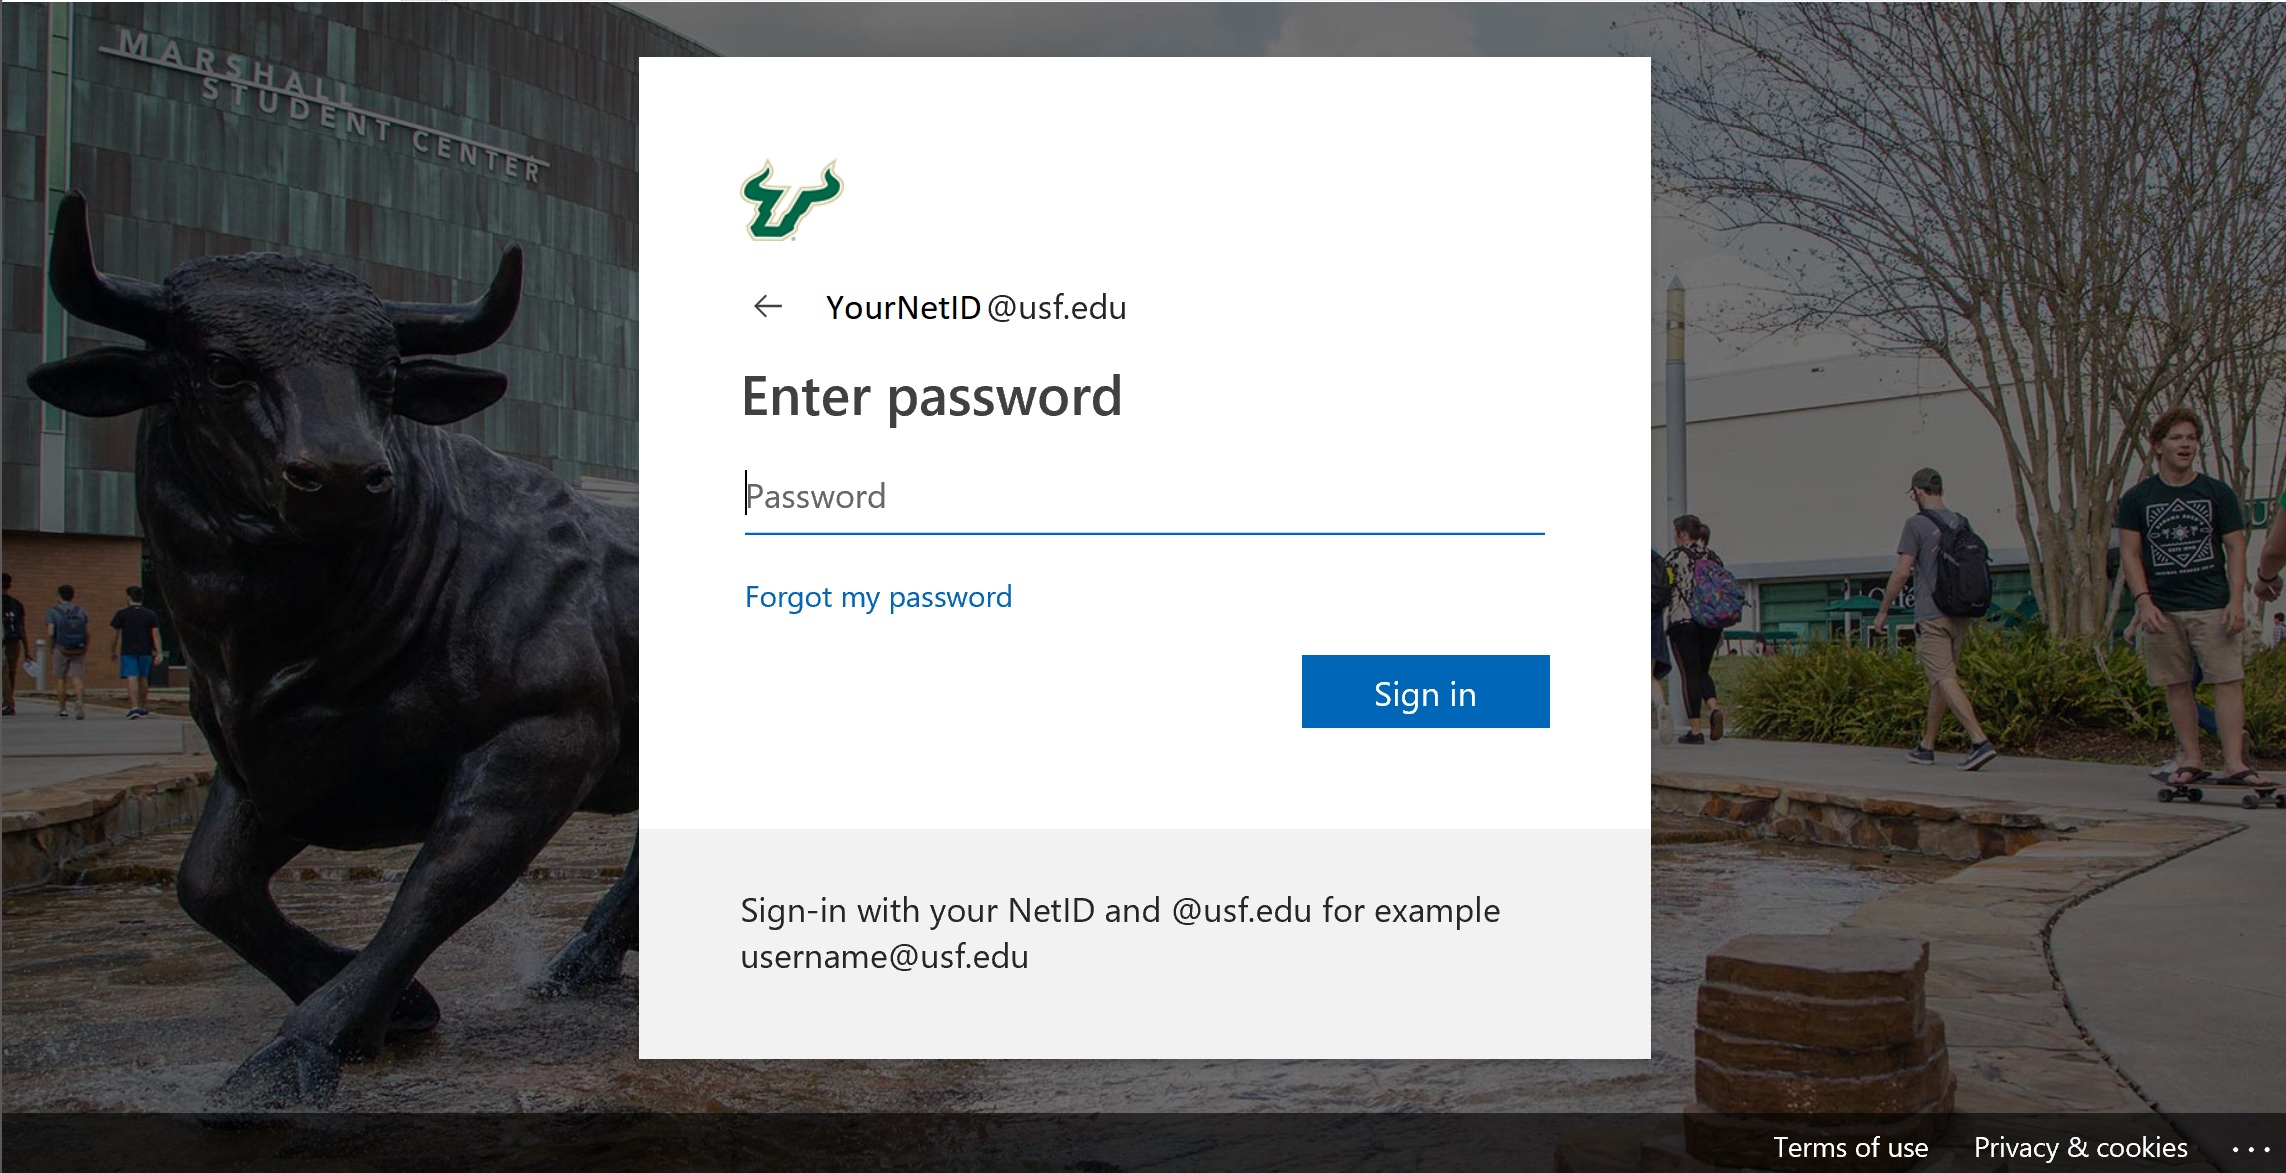
You will be redirected to a site with a USF image to enter your password.Info Power BI might skip steps 5 and 6 if you've already signed into to another system in this browser.
Enter your Net ID password.
- Click the Sign In button.
The Power BI system will load.
Searching for a Report
| Anchor | ||||
|---|---|---|---|---|
|
There are four ways to find a report or dashboard in Power BI: search, shared with me, workspaces, and apps.
Search:
| Anchor | ||||
|---|---|---|---|---|
|
- Click the Search box in the top right corner of the page.
- Type keywords found in either the report or dashboard title.
A list will populate of possible options. - Click on the report to open.


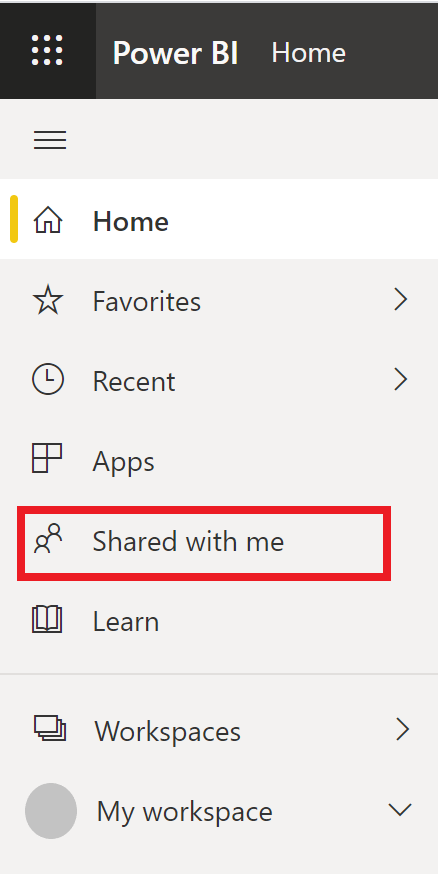
Shared with me:
| Anchor | ||||
|---|---|---|---|---|
|
If someone has shared a report or dashboard with you, you can always find it in the Shared with me section.
- Click on Shared with me on the left side of your screen.
A list will automatically populate if you have shared reports or dashboards. - Click the report name to open.

| Info |
|---|
You can filter the reports in this area by choosing the Workspace or person who shared the report with you. |
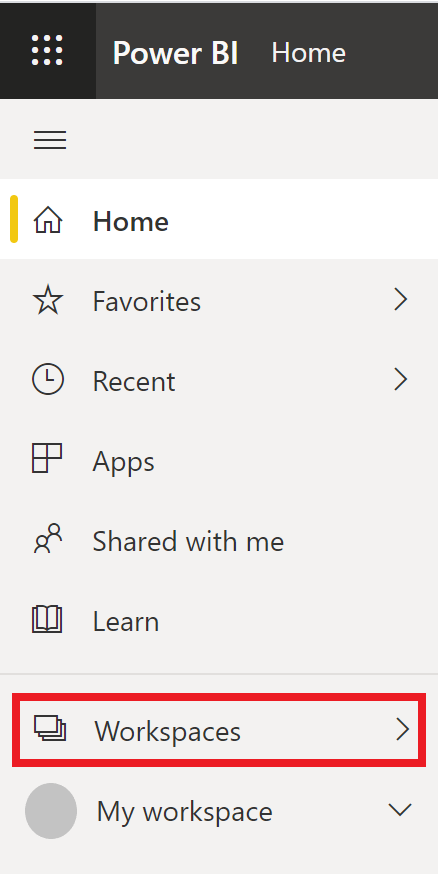
Workspaces:
| Anchor | ||||
|---|---|---|---|---|
|
These spaces group dashboards and reports into sets of similar reports, much like you might use a folder for your files on a computer. You will have a workspace for most of your Teams.
- Click on Workspace on the left side of your screen to see your list of workspaces.
A list will automatically populate. - Click on the report or dashboard you want to open.

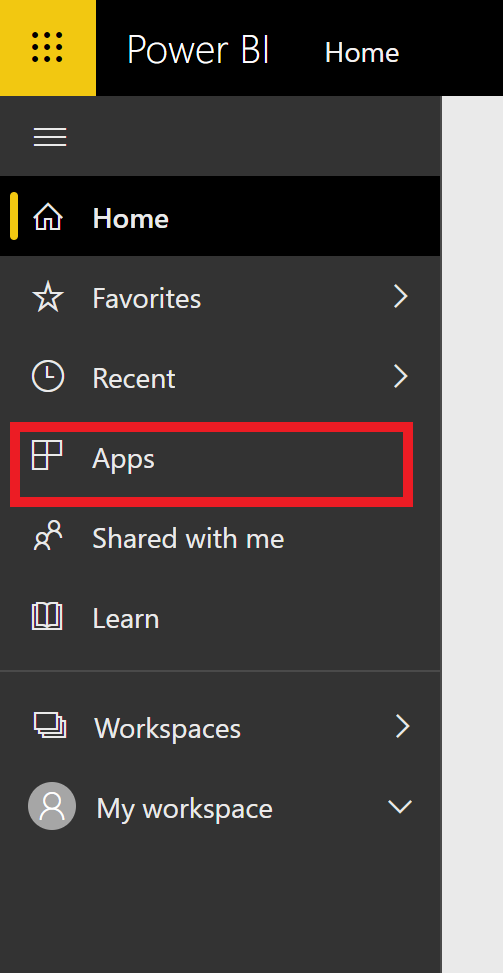
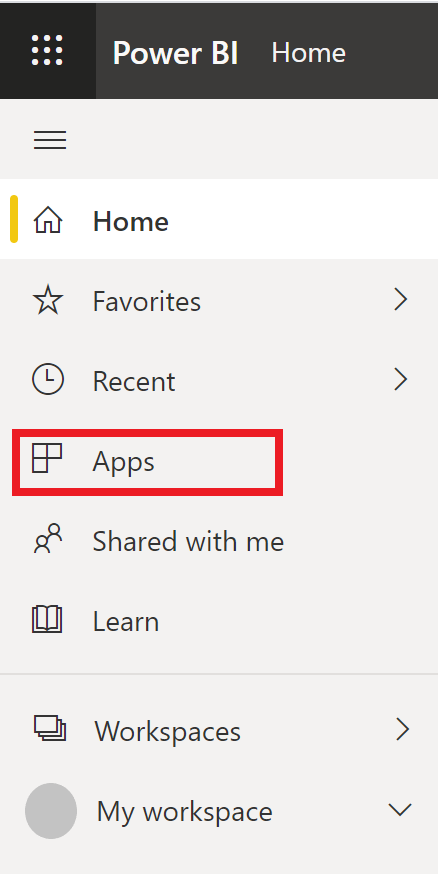
Apps
| Anchor | ||||
|---|---|---|---|---|
|
You may only have access to a report through an App. Apps are like workspaces in that they group reports into sets from a workspace.
- Click on Apps on the left side of your screen to see your loaded apps.
Apps available to you are populated on the right side of the screen. - Click on the app you want to open.