Power BI is a business analytics service that provides interactive visualizations and business intelligence capabilities that allow the USF community to view and create reports and dashboards. Data is used from multiple University of South Florida sources to provide reports that inform data-driven decisions. Reports for data out of GEMS, FAST, Archivum, and Health Banner may be shared with you based on your role at USF.
Power BI Reports
| Anchor | ||||
|---|---|---|---|---|
|
- Go to http://app.powerbi.com
- Enter your USF email address. This is your Net ID + @usf.edu as an employee.
- Click the Next button.
You will be redirected to a USF site to enter your password. See Figure 1 below. - Enter your Net ID password.
- Click the Sign In button.
The Power BI system will load.
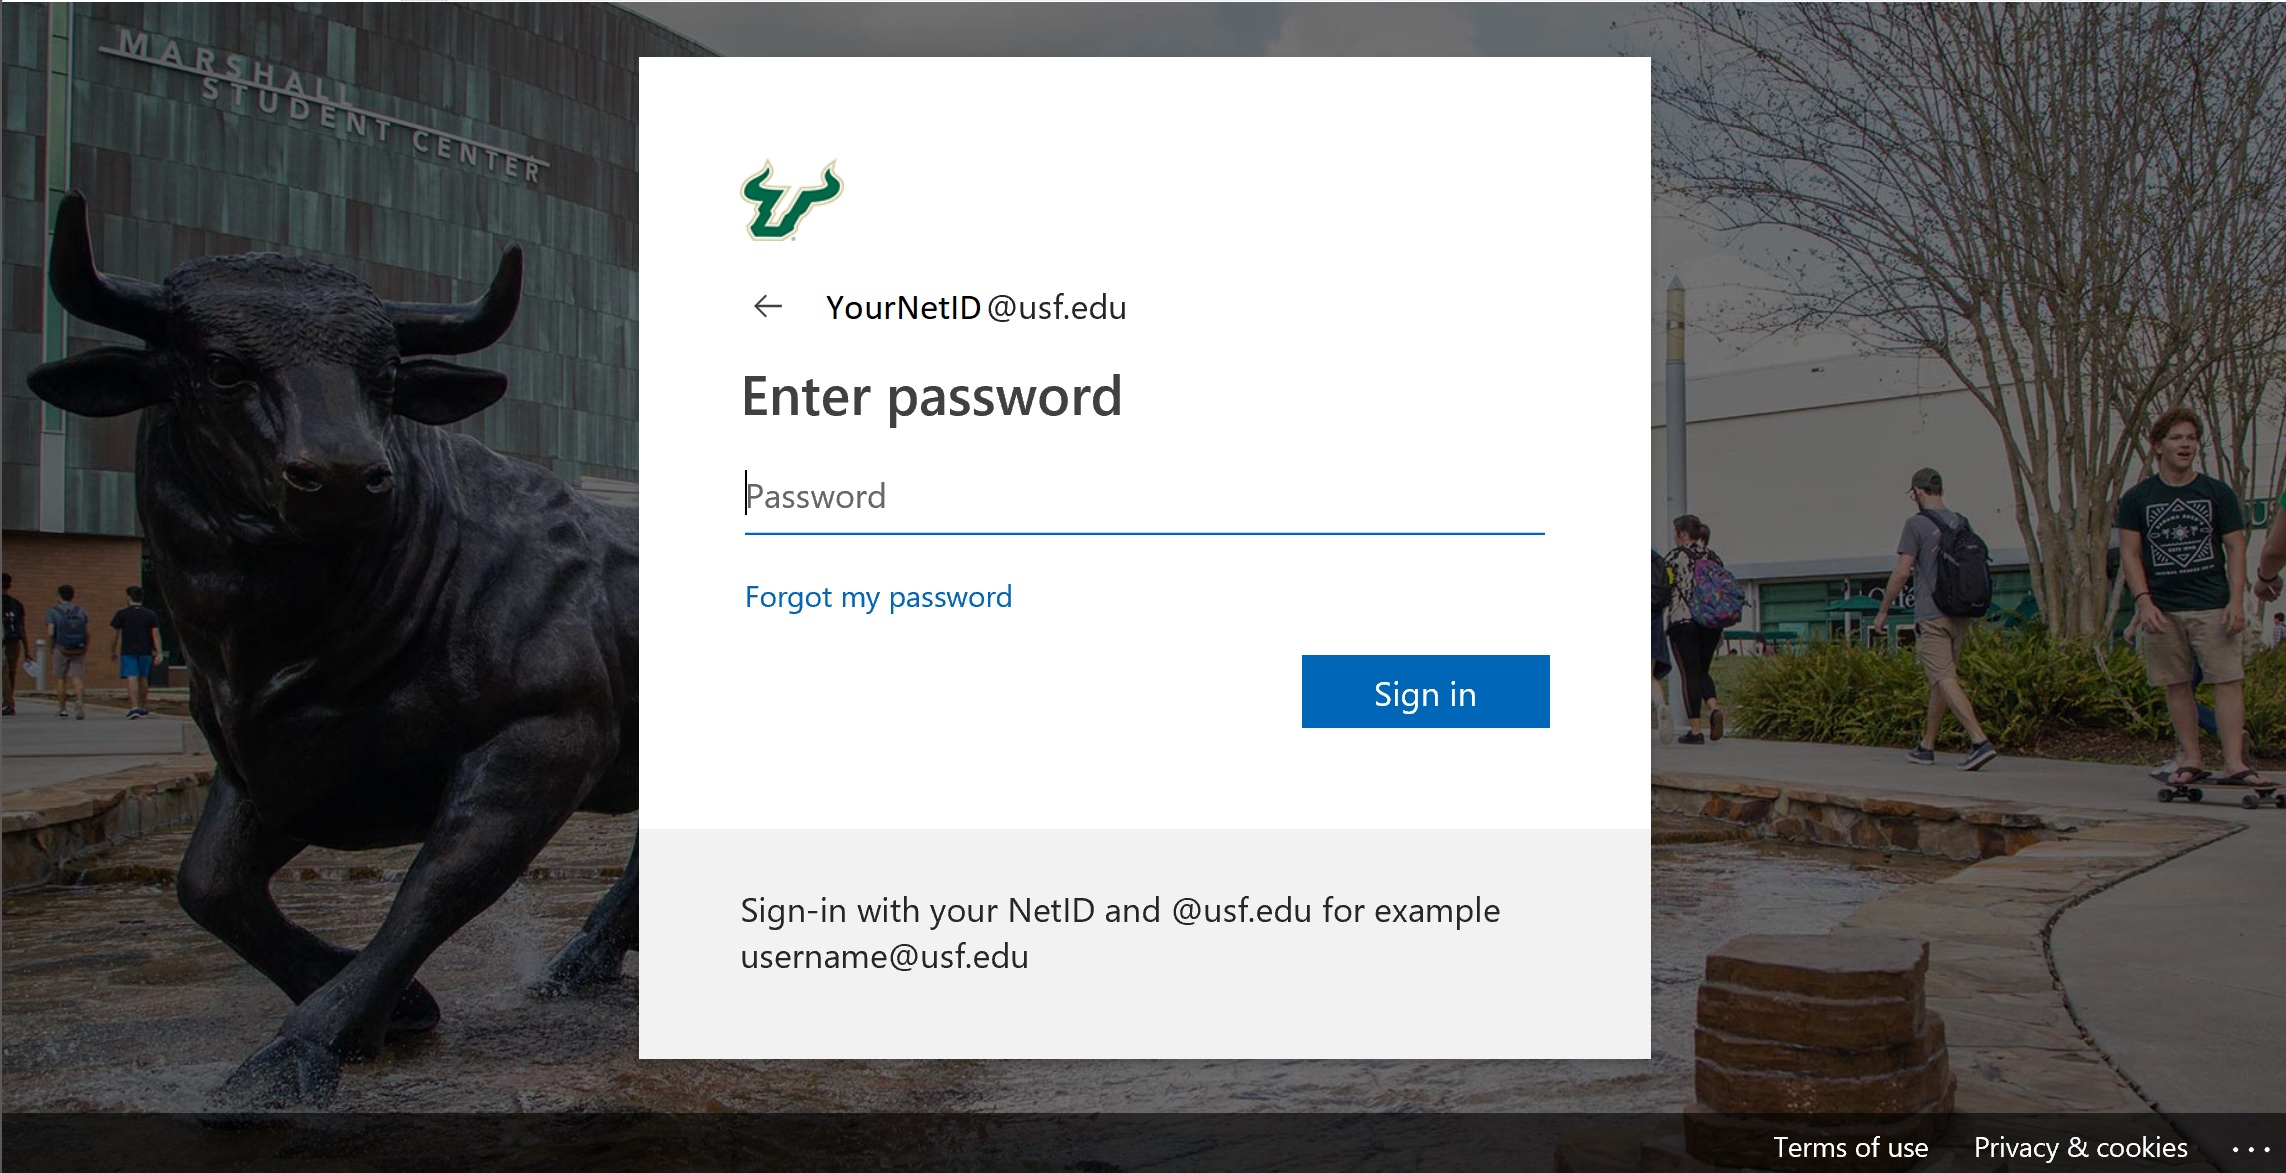
Figure 1: USF Sign on Page
Power BI Reports
| Anchor | ||||
|---|---|---|---|---|
|
Search:
| Anchor | ||||
|---|---|---|---|---|
|
- Click the Search box in the top right corner of the page.
- Type keywords found in either the report or dashboard title.
- A list will populate of possible options.
- Click on the report to open.


Shared with me:
| Anchor | ||||
|---|---|---|---|---|
|
If someone has shared a report or dashboard with you, you can always find it in the Shared with me section.
- Click on "Shared with me" on the left side of your screen.
- A list will automatically populate if you have shared reports or dashboards.
- Click to open.

| Info |
|---|
You can filter the reports in this area by choosing the Workspace or person who shared the report with you. |
Workspaces:
| Anchor | ||||
|---|---|---|---|---|
|
These spaces give access to specific dashboards and reports. You will have a workspace for most of your Teams.
- Click on "Workspace" to see your list.
- A list will automatically populate.
- Click on the report or dashboard you want to open.
