![]()
Student Success Modality Report
This report provides a summary of the number of sections, course section enrollment, gross student credit hours (i.e., SCH), DFW grade percentage by instruction modality. It also provides an average term GPA comparison among students who were enrolled in distance, classroom, or hybrid courses. Data include spring, summer and fall semesters for the past 5 years.
Data Source: SID
Refresh schedule: Semester. The “Date Refreshed” timestamp on each page indicates the time when the data was last refreshed.
- Enrollment by Instruction Modality -> Provides a summary of the number of sections, course section enrollment, and gross SCH by instruction modality. Filters are available to view numbers by semester, benchmark, campus, college, department , course name, course site and course level
- Course Success Rate ->Provides DFW grade percentage by instruction modality. Filters are available to view DFW number/rate by semester, campus, college, department, course name, course site and course level.
- Student Modality ->Provides headcount and average term GPA for students enrolled in different modality: distance, classroom, and hybrid. Student modality follows Florida BOG definitions, and students are placed into mutually exclusive categories based on the instruction modality of courses they were enrolled. Filters are available to view comparisons among gender, ethnicity, first generation, Pell status, residency type, student type and student level.
| Data Element | Data Source | Description | Report Page |
|---|---|---|---|
Campus | SID → SID_COURSES_TAKEN → CAMPUS_F | Course section campus | Enrollment by Modality Course Success Rate |
Campus | SID → SID_ENROLLMENTS → HOMECAMPUS | Student home campus | Student Modality |
College | SID_Title_GlobalDepartments_All_Vw | Global College code (derived using xref-rules created by IT for mapping course department ID to one usf global college code and department. | All |
| CollegeTitle | SID_Title_GlobalDepartments_All_Vw | Global college title | All |
DepartmentTitle | SID_Title_GlobalDepartments_All_Vw | Global department code (derived using xref-rules created by IT for mapping course department ID to one usf global college and department. | All |
Course level | Calculated field using course number BANNER->SSBSECT->SSBSECT_CRSE_NUMB | Course Level Definition: UGLL=1000-2999 Courses UGUL=3000-4999 Courses GR1=5000-69999 Courses GR2> 7000 Courses GR3 = Medical sections Placeholder (INTO, Intl Exch, Palazzi, Semester) | Summary of sections by one USF structure Drill-through pages |
Sections | BANNER→SFRSTCR, SFRSTCA | Count of sections – active or held as filtered. Active sections are selected by default. | All |
PartOfTerm | BANNER->SSBSECT->SSBSECT_PTRM_CODE | Part of the term | All |
Section Type | BANNER->SSBSECT->SSBSECT_SCHD_CODE | The section type of the course section (i.e., Class Lecture) | |
Section Enrl | BANNER->SSBSECT->SSBSECT_ENRL | Number of section enrollments or seats filled | All |
Seat Avail | BANNER->SSBSECT->SSBSECT_MAX_ENRL | Total seats available in the course sections. For the previous year, this category includes sections with enrollment only. Current year numbers include sections with or without enrollment. | All |
SCH | BANNER->SSBSECT->SSBSECT_TOT_CREDIT_HRS | Total gross student credit hours generated | All |
Sec Diff | Calculated field | Current year – Previous year numbers | All |
Percent change in Sec | Calculated field | Percentage change over one year difference | All |
Enrl Diff | Calculated field | Current year – Previous year numbers | All |
Percent change in Enrl | Calculated field | Percentage change over one year difference | All |
SCH Diff | Calculated field | Current year – Previous year numbers | All |
Percent change in SCH | Calculated field | Percentage change over one year difference | All |
Avail Diff | Calculated field | Current year – Previous year numbers | All |
Percent change in Avail | Calculated field | Percentage change over one year difference | All |
%Prev Yr Seats Filled | Calculated field | Section Enrl/Seats Available | All |
Student Modality | Calculated field | Distance (AD, PD), Classroom (CL), Hybrid (HB) Follows BOG definitions. | Student Modality |
| Section Modality | SID → SID_INSTRUCTIONAL_ACTIVITY → DELIVERY_METHD_IND | AD: Full Distance Learning Course - 100% of the direct instruction of the course is delivered using some form of technology when the student and instructor are separated by time, space, or both. All special course components (exams, internships, practica, clinicals, labs, etc) that cannot be completed online can be completed off-campus. PD: Primarily Distance Learning Course - 80-99% of the direct instruction of the course is delivered using some form of technology when the student and instructor are separated by time, space, or both. There is a requirement for the student to attend campus or another explicit geographic location for a portion of the course. CL: Primarily Classroom Course - Less than 50% of the direct instruction of the course is delivered using some form of technology when the student and instructor are separated by time, space or both. This designation can include activities that do not occur in a classroom (ie, labs, internships, practica, clinicals, labs, etc). HB: Hybrid Course - 50-79% of the direct instruction of the course is delivered using some form of technology when the student and instructor are separated by time, space or both. | Enrollment by Modality Course Success Rate |
Filter Panels
Filters are listed on top panel of the report.
Notes:
- Click the down arrow to select from options in the filters and narrow down your results.
- To deselect an item, click on the option again.
- Some filters are radio buttons and you can select only one item. The items in these filters are indicated as round buttons
 .
. - Some filters allow multiple selections. To select multiples in a filter, hold the Ctrl key as you check the square boxes
.
- Filters for the report may not have Blank as an option.
Data Panel
This panel displays the filtered results. To work with data in this panel:
- Select an individual row in the table to highlight the item/row. Select it again to return to the full table view.
- You can sort the data by column values, if the sorting is available for that column. Hover your mouse over the last row item in the column header and if a small black triangle appears
 , you can sort that column in ascending or descending order by clicking on your mouse.
Select a column header to sort by that value, such as College or Department.
Tasks
Export Data to Excel
To export the data results to Excel, hover your mouse over the upper right hand side corner of the data table and a horizontal menu bar  will pop up. Click the
 ![]() in the top right corner .
in the top right corner .
A drop down menu will appear with 'Export data' as one of the options. Select Export Data to work with the data in Excel.
Note : The exported data in Excel may not look exactly like the screen.
![]()
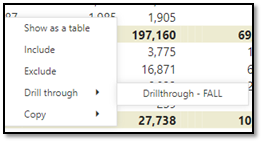
Drill through
To 'Drill through', right click on a data cell in the data table. A menu will pop up with 'Drill Through" as one of the options. Selecting drill-though option will open another window with the details.
Note : All data tables may not have 'Drill through' functionality.
Reset to Default
If you have made any changes, such as implementing filters or sorting the table, you have the ability to return the sorting and filtering to the report creator's default view. Click the Reset to Default image in the Report Header: ![]()