| Anchor | ||||
|---|---|---|---|---|
|
| Table of Contents |
|---|
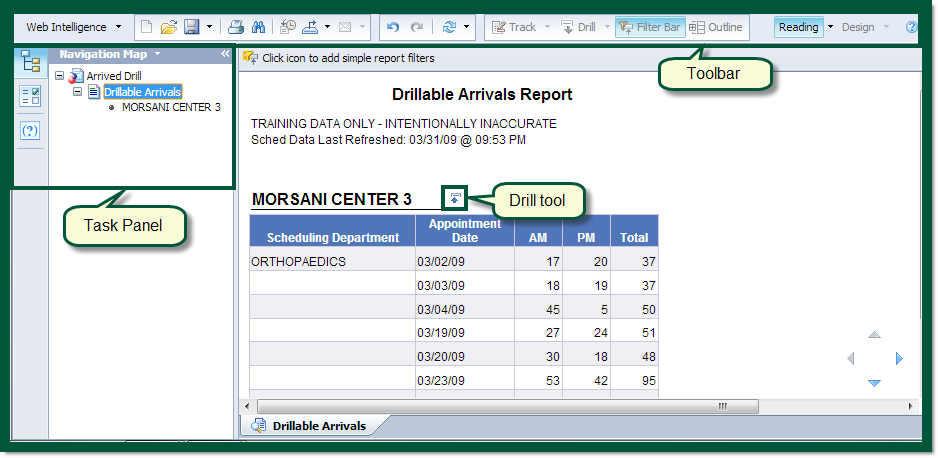
Figure 1: Pre-Defined Report Overview. Click image to enlarge.
Tool Bar
The Tool Bar features include:
...
- Web Intelligence - modify Left Pane, Report tabs, Status Bar.
- Folder - Open a document.
- Save - Save/Save As.
- Print – exports document to PDF for printing.
- Binoculars – search.
- History
- Export– access to download document into an Excel, PDF, or CSV file.
- View – view document in Page, Draft, or PDF mode as a well as turn on/off Left Panel and Status bar.
- Print – exports document to PDF for printing.
- Binoculars – search.
- Undo/Redo.
- Minimize/Maximize.
- Page toggle – move from page to page or from first to last page.
- Refresh All – refreshes data.
- Query view.
- Drilling Indicator – base Track - activate or deactivate data tracking mode. Base licenses do not have drilling capability and will not have drilling indicator on toolbar.Snapshot – captures a snapshot of each level of report, as indicated, for download, this feature will be grayed out.
- Drilling Indicator – Navigate the report hierarchy. Base licenses do not have drilling capability, this feature will be grayed out.
Report Results
This area displays the Query or report, based on the Prompts indicated.
Task Panel
The Task Panel will vary based on the type of report and can be toggled on and off. The Task Panel houses multiple features and may or may not be visible when a report is first accessed. Located on the left side of a Pre-Defined report, the Task Panel offers additional functionality and navigation with the report. The Task Panel is not always displayed; click the arrow on the center of the right-hand side of the Task Panel to toggle on/off. See figure any icon in task panel to open. See Figure 1 above.
The Task Panel options vary depending on the report and license level. Below are the different features available through the Task Pane:
- Document Summary
- Data Summary
- Chart and Table Types
- Available Objects
- Document Structure and Filters
- Navigation Map - available to all users
- User Prompt InputFindInput - available to all users
Document Summary
The Document Summary describes information about the report's creation. The information contained here can not be dragged onto the report. See figure Figure 2 below.
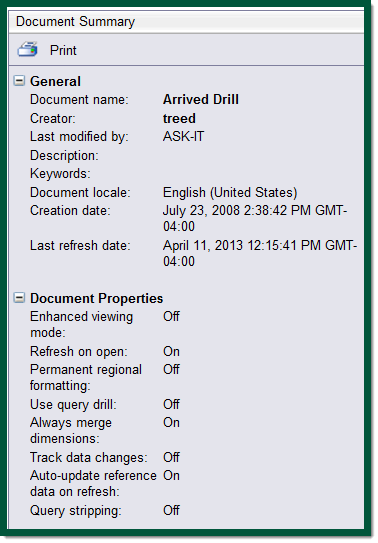
Figure 2: Document Summary. Click image to enlarge.
Data Summary
The Data Summary lists the sources, objects found in the report, and formulas used. The information contained here can not be dragged onto the report. See figure Figure 3 below.
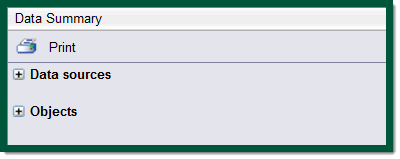
Figure 3: Data Summary.
Chart and Table Types
Chart and Table Types gives you different views and options that you can drag and drop onto the report to create charts or new tables to highlight specific information within the report. See figure Figure 4 below.
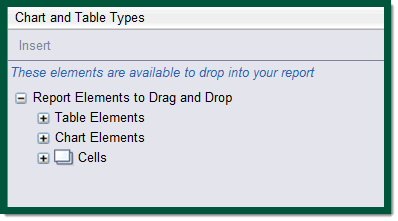
Figure 4: Chart and Table Types. Click image to enlarge.
Available Objects
Available Objects lists the objects available within the report which you can drag and drop into the tables you've just created by using Chart and Table Types. Using Available Objects allows you to create a new, customized view of your information. See figure Figure 5 below.
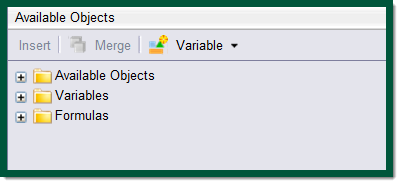
Figure 5: Available Objects.
Document Structure and Filters
Document Structure and Filters describes the structure of the report and lists any filters applied to the information. This area is important to look at when working with filters. See figure Figure 6 below.
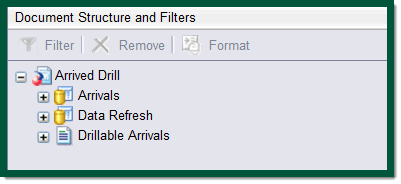
Figure 6: Document and Structures.
Navigation Map
The Navigation Map shows which report you are in. You can navigate to specific areas within the report by clicking on the desired area in the Navigation Map. See figure Figure 7 below.


Figure 7: Navigation Map Task Pane. Click image to enlarge.
User Prompt Input
The User Prompt Input allows you to select a new prompt to re-run a query. Use the User Prompt Input only when a specific criterion is known. No values are listed in the User Prompt Input. See figure Figure 8 below.


Figure 8: User Prompt Input Task Pane. Click image to enlarge.
...
Find allows you to find information within a report. To select any of these areas:
- Click on the binoculars to open the Find function.
- Type in your search criteria and click Find Next.
See figure 9 below.
Figure 9: Find Function. Click image to enlarge.
Snapshot
A snapshot, or a picture, may be taken of report data at multiple levels. This feature is useful when drilling to different levels of a report; you can capture a Snapshot at each or all applicable levels. Once you are ready to download the report data into another application (see Export Data below), you will be able to download all Snapshots in one step.
In order to use the Snapshot feature you must:
- Have the appropriate license with Drilling access.
- Work in a Drillable report.
- Turn on the Drilling mode.
To take a snapshot:
- Run a report.
- Drill to the report detail you desire.
- Click on the camera icon in the upper right corner. See figure Figure 1 above.
- A new tab containing the data snapshot will be created at the bottom of the report.
The snapshot tabs, and any tab for that matter, can be renamed. - To rename, right-click the tab and select Rename.