If the visual has the hierarchy, the  Image Addedmenu will appear when you hover on the top left side of the visual and click on three horizonal dots. From the menu options, select “Show as a table”. Turn on drill down first by selecting the downward arrow. The grey background Image Addedmenu will appear when you hover on the top left side of the visual and click on three horizonal dots. From the menu options, select “Show as a table”. Turn on drill down first by selecting the downward arrow. The grey background  Image Added lets you know that drill down is active. Image Added lets you know that drill down is active.  Image RemovedYou can see the data table below the chart Image RemovedYou can see the data table below the chart 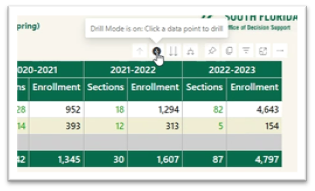 Image Added Image Added Selecting  Image Addedwill expand another level of hierarchy. Image Addedwill expand another level of hierarchy.  Image RemovedIf you want to see the chart and table side by side, you can switch it to vertical layout by clicking on the “Switch format.” Image RemovedIf you want to see the chart and table side by side, you can switch it to vertical layout by clicking on the “Switch format.”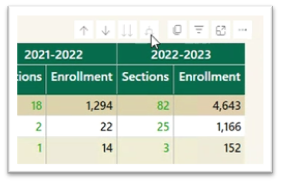 Image Added Image Added Selecting the double arrow  Image Added drill-down icon takes you to the next level in the hierarchy. Image Added drill-down icon takes you to the next level in the hierarchy.  Image Removed Image Removed  Image Removed Image Removed 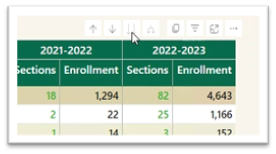 Image Added Image Added Selecting  Image Addedwill take you one level up in hierarchy. The arrows will be greyed out if the option is not available. Image Addedwill take you one level up in hierarchy. The arrows will be greyed out if the option is not available. space |