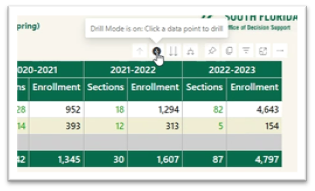
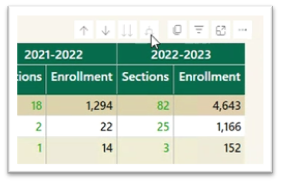
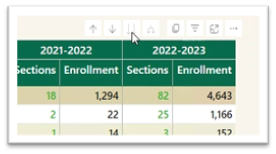
To see the data for any chart or graph, hover over the top right-hand side of the visual and click on three horizonal dots. From the menu options, select “Show as a table”.  You can see the data table below the chart.  If you want to see the chart and table side by side, you can switch it to vertical layout by clicking on the “Switch format.”
 Image Removed Image Removed Image Added Image Added  Image Removed Image Removed Image Added Image Added |