![]() Work In Progress
Work In Progress
Admission Profile and Student Success
This set of reports provide academic profile for applicants, and retention and graduation information for enrolled students. The historical data is available for the past 7 years. These reports enable leadership to visualize, slice and dice the data and facilitate with strategic planning.
Data Source: SID
Refresh schedule: Data is refreshed every semester. The “Data Refreshed” field on the bottom right of the page indicates when the data was extracted from SID. The "Data Updated" field on the top of the report indicates when the report was published. These two dates are often different.
Below are the tabs for the report:
- Score and GPA Grid → This tab displays the SAT and High School GPA information for applicants for summer/fall cohort. This tab can be sliced for Ethnicity, Gender, Campus, College and Residency.
- GPA By Ethnicity → This tab displays the High School GPA breakdown by Ethnicity for applicants. This tab can be sliced for Gender, Campus, College and Residency.
- Test Scores By Ethnicity → This tab displays the SAT Scores breakdown by Ethnicity for applicants. This tab can be sliced for Gender, Campus, College and Residency.
- GPA Trend For Applicants → This tab displays the trend of High School GPA for applicants for past 5 years. This tab can be sliced for Ethnicity, Gender, Campus, College and Residency.
- Test Scores Trend For Applicants → This tab displays the trend of SAT Scores for applicants for past 5 years. This tab can be sliced for Ethnicity, Gender, Campus, College and Residency.
- APR Grid → This tab displays the academic progress rate for enrolled students by High School GPA and Test Scores. This tab can be sliced for Ethnicity, Gender, Campus, College and Residency. One can view the Retained 2.0% by clicking on "Retained 2.0%" button right below the slicers, Retained 2.0 Numbers by pressing the "Retained 2.0 N" button and enrollment Numbers by pressing the "Enrolled N" button.
- Retention Grid → This tab displays the retention information for enrolled students by High School GPA and Test Scores. This tab can be sliced for Ethnicity, Gender, Campus, College and Residency. One can view the retention 0% by clicking on "Retention %" button right below the slicers, Retention Numbers by pressing the "Retention N" button and enrollment Numbers by pressing the "Enrolled N" button.
- 4 Yr Grad by GPA and Scores → This tab displays the 4 year graduation heatmap for enrolled students by High School GPA and Test Scores. This tab can be sliced for Ethnicity, Gender, Campus, College and Residency. One can view the 4 year graduation 0% by clicking on "4 YR Grad %" button right below the slicers, 4 Year Graduation numbers by pressing the "4 YR Grad N" button and enrollment Numbers by pressing the "Enrolled N" button.
- 6 Yr Grad by GPA and Scores → This tab displays the 6 year graduation heatmap for enrolled students by High School GPA and Test Scores. This tab can be sliced for Ethnicity, Gender, Campus, College and Residency. One can view the 6 year graduation 0% by clicking on "6 YR Grad %" button right below the slicers, 6 Year Graduation numbers by pressing the "6 YR Grad N" button and enrollment Numbers by pressing the "Enrolled N" button
- 4 Yr Grad Rate by GPA → This tab displays the 4 year graduation % for enrolled students by High School GPA. This tab can be sliced for Ethnicity, Gender, Campus, College and Residency. By clicking on the image
 , you can change the orientation of the report from horizontal bars to vertical columns.
 - 4 Yr Grad Rate by Test Scores→ This tab displays the 4 year graduation % for enrolled students by SAT Scores. This tab can be sliced for Ethnicity, Gender, Campus, College and Residency. By clicking on the image , you can change the orientation of the report from horizontal bars to vertical columns.
- 4 Yr Grad Trend by GPA → This tab displays the 4 year graduation trend for enrolled students by High School GPA. This tab can be sliced for Ethnicity, Gender, Campus, College and Residency.
- 4 Yr Grad Trend by Test Scores → This tab displays the 4 year graduation trend for enrolled students by Test Scores. This tab can be sliced for Ethnicity, Gender, Campus, College and Residency.
Data Element | Data Source (underlying data field) | Description | Report Pages |
| Gender | SID → SID_ENROLLMENTS → GENDER | The Gender at the time of Enrollment | All Pages |
| Residency | SID → SID_ENROLLMENTS →ETHNIC and FEE_CLASS_RES | The Residency Status at the time of Enrollment. The logic is below: When Ethnic = 'O' Then 'International' | All Pages |
Filter Panels
Filters are listed on top or on side panel of the report.
Notes:
- Click the down arrow to select from options in the filters and narrow down your results.
- To deselect an item, click on the option again.
- Some filters are radio buttons and you can select only one item. The items in these filters are indicated as round buttons
 .
. - Some filters allow multiple selections. To select multiple values in a filter, hold the Ctrl key as you check the square boxes
.
- Filters for the report may not have Blank as an option.
Data Panel
This panel displays the filtered results. To work with data in this panel:
- Select an individual row in the table to highlight the item/row. Select it again to return to the full table view.
- You can sort the data by column values, if the sorting is available for that column. Hover your mouse over the last row item in the column header and if a small black triangle appears
 , you can sort that column in ascending or descending order by clicking on your mouse.
Options for the Data Panel
Export Data to Excel
To export the data results to Excel, hover your mouse over the upper right hand side corner of the data table and a horizontal menu bar  will pop up. Click the
 ![]() in the top right corner .
in the top right corner .
A drop down menu will appear with 'Export data' as one of the options. Select Export Data to work with the data in Excel.
Note : The exported data in Excel may not look exactly like the screen.
![]()
Focus Mode
To see the data in Focus Mode, hover your mouse over the upper right hand side corner of the data table and a horizontal menu bar will pop up. Click the option for Focus Mode ![]() It allows the visual to take the entire space in the report canvas. Full screen mode will persist until you exit out or click on
It allows the visual to take the entire space in the report canvas. Full screen mode will persist until you exit out or click on  on the top left hand side.
When in Focus Mode, click the ![]() in the top right corner and a drop down menu will appear with the following options:
in the top right corner and a drop down menu will appear with the following options:

You can export data, or see the data in a table by selecting the appropriate option.
Spotlight
Spotlight causes all other visuals on the page to fade so the selected visual is highlighted. To highlight a visual, click on more action ![]() and select
and select 
Drill Up and Drill Down
If the visual has the hierarchy, the 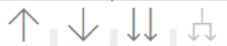 menu will appear when you hover on the top left side of the visual. Turn on drill down first by selecting the downward arrow. The grey background
 ![]() lets you know that drill down is active. Selecting
lets you know that drill down is active. Selecting ![]() will expand another level of hierarchy. Selecting the double arrow
will expand another level of hierarchy. Selecting the double arrow ![]() drill-down icon takes you to the next level in the hierarchy. Selecting
drill-down icon takes you to the next level in the hierarchy. Selecting ![]() will take you one level up in hierarchy. The arrows will be greyed out if the option is not available.
will take you one level up in hierarchy. The arrows will be greyed out if the option is not available.
Reset to Default
If you have made any changes, such as implementing filters or sorting the table, you have the ability to return the sorting and filtering to the report creator's default view. Click the Reset to Default image above the report in the Report Header: ![]()