Headcount reports is a set of following reports:
Headcount Reports
Headcount reports provide headcount information for 10 years at the latest benchmark. These reports enable leadership to visualize, slice and dice the data and facilitate with strategic planning. These reports are semester based reports.
Headcount All Benchmarks
Headcount All Benchmarks provide headcount information for all the benches for past 5 years. These reports are semester based reports.
Data Source: SID
Refresh schedule: Data is refreshed for all three semesters for all four benchmarks. The “Data as of” field on the bottom right of the page indicates when the data was last refreshed from SID database. The "Data Updated" field on the top of the report indicates when the report was last published. These two dates are often different because a report update could be change in visuals or navigation etc. and not necessarily a data refresh.
Headcount Reports
- One USF Quick Facts → This tab displays the One USF enrollment information at a glance for any given term. The driver for this tab is Semester and Term filters. Term filter is dependent on the Semester filter. This report will be blank, when the Semester filter and Term filter are out of sync. The visuals on this page has headcount information:
- By college
- By campus
- By full-time status
- By gender
- By race/ethnicity
- By residency
- By student type and New/Returning students (click the + sign in the matrix table to expand student level)
- College Level Quick Facts → This tab displays the summary of enrollment information for any given term for any college. This report will be blank, when the Semester filter and Term filter are out of sync. The visuals on this page has headcount information:
- By campus
- By department
- By full-time status
- By gender
- By race/ethnicity
- By residency
- By student classification
- By student type (click the + sign in the matrix table to expand student level)
- Trend by Semester → The tab displays the enrollment trend of degree-seeking undergraduate and graduate students by semester.
- Trend by Student Type → The tab displays the enrollment trend of degree-seeking undergraduate and graduate students by student level and student type.
- Trend by Campus → The tab displays the enrollment trend of either Spring, Summer, or Fall semesters by campus, student level, and student type in a tabular form. It also shows the difference from the previous term.
- Trend by Student Level → The tab displays the enrollment trend of either Spring, Summer, or Fall semesters by student level, student class level, and race/ethnicity in a tabular form. It also shows the difference from the previous term and the percentage of difference.
- Trend by College → The tab displays the enrollment trend of either Spring, Summer, or Fall semesters by college and departments in a tabular form (click the + sign in the matrix table to show departments).
- Trend by Race/Ethnicity and Gender → The tab displays the enrollment trend of either Spring, Summer, or Fall semesters by student level, race/ethnicity, and gender in a tabular form.
- Trend by Race/Ethnicity → The tab displays the enrollment trend of either Spring, Summer, or Fall semesters by race/ethnicity and student level.
- Trend by Gender → The tab displays the enrollment trend of either Spring, Summer, or Fall semesters by gender and student level..
- Trend by Accountability Plan Student Type → The tab displays the enrollment trend of degree-seeking students by accountability plan student type in Fall semesters only. It is an Accountability plan metric.
- Pell & Access Rate → The tab displays the Pell & Access Rate of undergraduate students in Fall semesters only.
- By college and department
- By campus
- By gender
- By race/ethnicity
- By residency
- By self reported first generation students
- By student type
The Access Rate Visual on this page is special visual. Access Rate Visual is locked for the "Pell Eligible = Yes" and and "Pell Recipient = All" population and will not respond to the "Pell Eligible" and "Pell Recipient" slicers on the tab. This visual has help ? enabled so if you hover over the visual, you can have more information about the Access Rate. Access Rate is an accountability plan metric and is calculated by dividing the number of Pell recipients by Pell eligible students.
Headcount All Benchmarks
- Benchmark by Term → The tab displays the undergraduate and graduate headcounts for a given semester by all available benchmarks (First Day, Drop/Add, Preliminary, and Final).
Trend by Benchmark → The tab provides a summary of enrollment trend of past 5 Spring, Summer, or Fall semesters for a given benchmark by student level, student type and New/Returning.
- Trend All Benchmark → Displays the enrollment trend of past 5 Spring, Summer, or Fall semesters of all benchmark by student level and student type in a matrix table.
- Benchmark Comparison → Displays the comparison of enrollment trend of past 5 Spring, Summer, or Fall semesters between the Final bench and any other selected bench.
Filters on the Filters Panel
There is a filter panel on the right which can be expanded or collapsed using the >> button. The filter panel has following filters:
- Academic Year
- Age Group
- Age Group 25
- Budget Entity
- Campus
- CIP
- College
- Degree Seeking
- Department
- FT PT
- Gender
- Honors
- Major
- New/Returning
- Race/Ethnicity
- Residency
- Strategic Emphasis
- Student Class Level
- Student Classification
- Student Level
- Student Type
Data Element | Data Source (underlying data field) | Description | Report Pages |
| Age Over 25 | SID → SID_PERSON_DEMO → BIRTH_YYYYMM_DT | Indicator if a student is above 25 years of age | All Tabs |
| Benchmark | SID → SID_ENROLLMENTS → BENCH | Benchmark such as Preliminary or Final | All Benchmark Report Tabs |
| Budget Entity | SID → SID_ENROLLMENTS → BE_CD | Budget entity such as E & G or Health Sciences | All Tabs |
| Campus | SID → SID_ENROLLMENTS → HOMECAMPUS | The Campus at the time of Enrollment | All Tabs |
| CIP | SID → SID_ENROLLMENTS → CIP_STUDENT | All Tabs | |
| College | SID → SID_ENROLLMENTS → GLOBAL_COLLEGE | The Global College at the time of Enrollment | All Tabs |
| Department | SID → SID_ENROLLMENTS → GLOBAL_DEPT | The Global Department at the time of Enrollment | All Tabs |
| Ethnicity | SID → SID_ENROLLMENTS→ETHNIC | The Ethnicity at the time of Enrollment | All Tabs |
| Full Time Indicator | SID → SID_ENROLLMENTS → CURR_TERM_CRS_LOAD | If the student is full time or part time based on the credit hours for the term. For Fall and Spring terms, UG students enrolled in >= 12 credits are considered full-time and GR students enrolled >= 9 credits are considered full-time. For Summer term, UG students enrolled in >= 9 credits are considered full-time and GR students enrolled >= 6 credits are considered full-time. | All Tabs |
| Gender | SID → SID_ENROLLMENTS → GENDER | The Gender at the time of Enrollment | All Tabs |
| Honors | SID → SID_ENROLLMENTS → HONORS | The Honors Student Status | All Tabs |
| New/Returning | SID → SID_ENROLLMENTS → STU_RECENT_ADM_DT | If the student is a New student or Returning from the previous term. If the Recent admit date is same as the Termid, then student is New else the student is Returning. | All Tabs |
| Residency | SID → SID_ENROLLMENTS →ETHNIC and FEE_CLASS_RES | The Residency Status at the time of Enrollment. The logic is below: When Ethnic = 'O' Then 'International' | All Tabs |
| Semester | SID → SID_TERMID → MONTH | Semester such as Fall, Spring or Summer | All Tabs |
| Student Classification | SID → SID_ENROLLMENTS → STU_CLASS_LEVEL | Student Classification such as Lower Level, Upper Level, Grad I and Grad II. The logic is below: When Stu_Class_Level = 'A' Then 'Grad II' | All Tabs |
| Student Level | SID → SID_ENROLLMENTS → STU_CLASS_LEVEL | Student level such as Undergraduate or Graduate. The logic is below: When STU_CLASS_LEVEL ='N' Then 'Non-Degree Seeking' | All Tabs |
| Student Type | SID → SID_ENROLLMENTS → STU_RECENT_ADM_TYP | Student Type such as FTIC or Masters | All Tabs |
| Term | SID → SID_ENROLLMENTS → TERMID | Term such as Fall 2020 or Spring 2018 | All Tabs |
Filter Panel
Filters are listed on the side panel of the report.
Notes:
- Click the down arrow to select from options in the filters and narrow down your results.
- To deselect an item, click on the option again.
- Some filters are radio buttons and you can select only one item. The items in these filters are indicated as round buttons
 .
. - Some filters allow multiple selections. To select multiple values in a filter, select the square boxes
.
Data Panel
This panel displays the filtered results. To work with data in this panel:
- Select an individual row in the table to highlight the item/row. Select it again to return to the full table view.
- You can sort the data by column values, if the sorting is available for that column. Hover your mouse over the last row item in the column header and if a small black triangle appears
 , you can sort that column in ascending or descending order by clicking on your mouse.
Options for the Data Panel
Export Data to Excel
To export the data results to Excel, hover your mouse over the upper right hand side corner of the data table and a horizontal menu bar 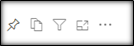 will pop up. Click the
 ![]() in the top right corner .
in the top right corner .
A drop down menu will appear with 'Export data' as one of the options. Select Export Data to work with the data in Excel.
Note : The exported data in Excel may not look exactly like the screen.
![]()
Focus Mode
To see the data in Focus Mode, hover your mouse over the upper right hand side corner of the data table and a horizontal menu bar will pop up. Click the option for Focus Mode ![]() It allows the visual to take the entire space in the report canvas. Full screen mode will persist until you exit out or click on
It allows the visual to take the entire space in the report canvas. Full screen mode will persist until you exit out or click on  on the top left hand side.
When in Focus Mode, click the ![]() in the top right corner and a drop down menu will appear with the following options:
in the top right corner and a drop down menu will appear with the following options:
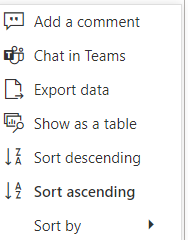
You can export data, or see the data in a table by selecting the appropriate option.
Spotlight
Spotlight causes all other visuals on the page to fade so the selected visual is highlighted. To highlight a visual, click on more action ![]() and select
and select 
Filters/Slicers on a visual
To find out what are the filters on any particular visual, select that visual and on the top right hand side, a menu bar of options will appear. There will be an option that looks like Filter on three horizonal bars, and if you select that, you can see what slicers are impacting that visual. Currently this menu bar is not available for Line Charts.
Matrix Visual: Drill Up and Drill Down
If the visual has the hierarchy, the 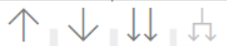 menu will appear when you hover on the top left side of the visual. Turn on drill down first by selecting the downward arrow. The grey background
 ![]() lets you know that drill down is active. Selecting
lets you know that drill down is active. Selecting ![]() will expand another level of hierarchy. Selecting the double arrow
will expand another level of hierarchy. Selecting the double arrow ![]() drill-down icon takes you to the next level in the hierarchy. Selecting
drill-down icon takes you to the next level in the hierarchy. Selecting ![]() will take you one level up in hierarchy. The arrows will be greyed out if the option is not available.
will take you one level up in hierarchy. The arrows will be greyed out if the option is not available.
Reset to Default
If you have made any changes, such as implementing filters or sorting the table, you have the ability to return the sorting and filtering to the report creator's default view. Click the Reset to Default image above the report in the Report Header: ![]()