SSRA Headcount Dashboard
- Zhong Zheng
- Sangita Singh
- Shruti Kumar
Headcount Reports is a set of following reports:
Headcounts By Semester
Headcount reports provide headcount information for 10 years at the latest benchmark for every semester. These reports enable leadership to visualize, slice and dice the data and facilitate with strategic planning.
Headcounts By Semester - All Benchmarks
Headcount All Benchmarks provide headcount information for all the benches for the past 5 years for every semester.
Annual Unduplicated Headcounts
This report captures the “unduplicated” headcount for the AY. i.e. the students are counted once within the AY. The status of the student (e.g., part-time or full-time, undergraduate or graduate) is determined using the first term of enrollment – Fall, Spring or Summer in that order.
If a student is enrolled in the Fall term, their enrollment status from the Fall term is reflected (e.g., part-time or full-time, undergraduate or graduate etc.). For students not enrolled in Fall but enrolled in Spring are defaulted to their Spring status. If the student enrolls only in the summer and at no other time during the academic year, then the summer term is used to determine the student's status.
This methodology aligns with the IPEDS reporting for “unduplicated” headcount on the 12 month Enrollment survey.
Academic Program Review - Headcounts
These reports were specifically designed to provide headcount information about individual programs to be used in Academic Program Review and/or Programmatic Accreditation. These reports are academic year based reports. Additional documentation for these reports can be found here: Academic Program Review - Student Data Dashboards - Office of Decision Support - Confluence (atlassian.net).
Data Source: SID
Refresh schedule: Data is refreshed for all three semesters for all four benchmarks. The “Data as of” field on the bottom right of the page indicates when the data was last refreshed from SID database. The "Data updated" field on the top of the report indicates when the report was last published. These two dates are often different because a report update could be change in visuals or navigation etc. and not necessarily a data refresh.
Headcounts By Semester
- Quick Facts: USF → The tab displays a summary of the USF headcount information on the latest benchmark for any given term. It utilizes the Term filter(Spring, Summer, or Fall)for each year. The visuals on this page display the headcount information:
- By college
- By campus
- By full-time indicator
- By gender
- By race/ethnicity
- By residency
- By student type and New/Returning students (click the + sign in the matrix table to expand student level)
- Quick Facts: College Level → This tab displays a summary of headcount information categorized by Department and Student Type. It features a Headcount chart with a slicer to toggle amongst various filters, including Campus, Gender, Race/Ethnicity, Residency, Student Classification, and Full-time/Part-time status, for any selected term for any college. Additionally, filter for CIP is available for more detailed insights. The visuals on this page display the headcount information:
- By campus
- By department
- By full-time/part-time indicator
- By gender
- By race/ethnicity
- By residency
- By student classification
- By student type and New/Returning students (click the + sign in the matrix table to expand student level)
- Quick Facts: Pell & Access Rate → The tab displays the Pell and Access Rate of enrolled undergraduate students categorized by Access Rate and College. It features a Headcount chart with a slicer to toggle amongst various filters, including College, Gender, Residency, Race/Ethnicity, Student Type, and Campus, for any selected term within Fall semesters only. It shows data for one term at a time. Pell is assigned in the Fall term for the whole year and lags by one year. For example, Fall 2024 data will be available around November 2025.
The Access Rate is calculated by dividing the number of Pell recipients by the number of Pell-eligible students for those enrolled in the Fall semester. The visuals on this page provide Pell & Access Rate information:- By college
- By access rate
- By campus
- By gender
- By race/ethnicity
- By residency
- By student type
The Access Rate Visual on this page is special visual. Access Rate Visual is locked for the "Pell Eligible = Yes" and and "Pell Recipient = All" population. This visual has help ? enabled so if you hover over the visual, you can have more information about the Access Rate.
Access Rate is accountability plan metric and below is the methodology for Accountability Plan:
Access Rate calculation per BOG: The Access Rate is based on data from the enrollment table on the Student Instruction File (SIF), and the Awards table on the Student Financial Aid (SFA) file.
a. Numerator: The students from Financial Aid Awards table who received a Pell Grant ( award_prog_id='001' ) during the Fall term ( award_payment_term= 'yyyy08' ). BOG excludes non‐resident aliens (#2043 = ‘Y’) from both the numerator and denominator for this metric.
To determine Pell eligibility, in addition to demonstrating financial need, the US Dept. of Education considers other factors such as the student must be a US citizen or an eligible
noncitizen. There are a few exceptions whereby non‐resident aliens can receive a Pell grant.
b. Denominator: All degree‐seeking undergraduate (both lower and upper divisions) students enrolled in the Fall term. Exclude unclassified students (student_class_level=‘N’) and post‐baccalaureate students (stu_recent_adm_typ= 'P') from the denominator because these students are not eligible for a Pell grant.
The IPEDS methodology to generate their percentage of under‐graduates who received a Pell grant is different and is based on preliminary (SIFP) data.
a. Numerator: It is based on the number of students who received a Pell grant anytime during a particular academic year.
b. Denominator: It is based on the students enrolled during the Fall term – including unclassified students who are not seeking a degree and therefore not eligible for financial aid. The IPEDS Financial Aid survey imports the total headcount denominator from their Fall Enrollment survey which is at the time of preliminary data (SIFP).
- Trends → The tab displays the headcount trend of degree-seeking students by term and campus for the selected semester(Spring, Summer, or Fall). It includes slicers to toggle amongst Student Level, Student Type, Gender, Race/Ethnicity, Residency, Campus, Strategic Emphasis (Old and New).
- Trend by Semester → The tab displays a ten-year trend of graduate and undergraduate student headcounts by semester, with the default setting for degree-seeking set to "Y"(Yes).
- Trend by College → The tab displays a ten-year trend of student headcounts by college, for selected semester(Spring, Summer, or Fall). It shows data for one semester at a time.
- Details by Accountability Plan Student Type → The tab displays the headcount trend of degree-seeking students by Accountability Plan student type and student level in a tabular format, for Fall semesters only. This is an Accountability Plan metric.
- Additional Views → The tab displays the summary of headcounts by the term and student level(Undergraduate & Graduate). It includes slicers to toggle amongst college, campus and student type, student level and race/ethnicity, and race/ethnicity and gender for the selected semester(Fall, Spring or Summer).The default setting for degree-seeking is set to "Y"(Yes).
Headcounts By Semester - All Benchmarks
- Benchmarks by Term → The tab displays the undergraduate and graduate headcounts for a given term by all available benchmarks (First Day, Drop/Add, Preliminary, and Final).
Trend by Benchmark → The tab displays the headcount trend over the past 5 years by semesters (Spring, Summer, or Fall) for a given benchmark by student level, student type and New/Returning.
- Trend All Benchmarks → The tab displays the headcount trend over the past 5 years by semesters (Spring, Summer, or Fall) for all benchmark by student level and student type in a matrix table.
- Benchmark Comparison → The tab displays the comparison of headcount trend of past 5 years by semesters (Spring, Summer, or Fall), between two different selected benches using two slicers.
Annual Unduplicated Headcounts
- Annual Unduplicated Headcounts → The tab displays the annual unduplicated headcount by college group and college in a tabular format.
- Trend By College → The tab displays the annual unduplicated headcount trend over the past 10 years by college.
- Trend By Campus And Residency → The tab displays the annual unduplicated headcount trend over the past 10 years by campus, and residency.
- Trend by Diversity → The tab displays the annual unduplicated headcount trend by race/ethnicity, and gender.
- Trend by Student Type → The tab displays the annual unduplicated headcount trend of undergraduate, graduate, and non-degree students by student level and student type.
- Details By Student Classification And Student Class Level → The tab displays the annual unduplicated headcount trend by student class level and student classification in a tabular format.
- Details By college, CIP and Major → The tab displays the annual unduplicated headcount trend for Undergraduate, Graduate & Non-Degree students by College, CIP and Major in a tabular format.
Academic Program Review - Headcounts
- By Major, Fall Enrollment, and New Admits→ The tab displays the annual unduplicated student headcounts by academic year enrollment, fall enrollment, and new fall admits for the selected CIP Code and Degree Level.
By Student Level & Gender → The tab displays a trend of annual unduplicated academic year enrollment by student level and by gender, for the selected CIP Code and Degree Level.
- By Race/Ethnicity → The tab displays a trend of annual unduplicated academic year enrollment by race/ethnicity, for the selected CIP Code and Degree Level.
- By Student Classification → The tab displays a trend of annual unduplicated academic year enrollment by student classification, for the selected CIP Code and Degree Level.
- By Enrollment Type & Nationality → The tab displays a trend of annual unduplicated academic year enrollment by enrollment type and nationality, for the selected CIP Code and Degree Level.
Filters on the Filters Panel
There is a filter panel on the right which can be expanded or collapsed using the >> button. The filter panel has following filters:
- Academic Year
- Age Group
- Age Group 25
- Budget Entity
- Campus
- CIP
- CIP Code
- Citizenship
- College
- Concentration
- Degree Seeking
- Department
- First Generation - Effective AY 2024-2025, FAFSA changes make it easier for students to self-identify as first-generation by replacing a single question by separate parent education questions, leading to an increase in first-gen student identification.
- FT PT
- Gender
- Honors
- International
- Major
- Nation
- New/Returning
- Race/Ethnicity
- Residency
- State
- Strategic Emphasis New - Effective AY 2024-2025, the BOG has revised its methodology for categorizing Strategic Emphasis, reducing it from five distinct areas to one. "Non-SE" denotes Non-Strategic Emphasis data.
- Strategic Emphasis Old
- Student Class Level
- Student Classification
- Student Level
- Student Type
Data Element | Data Source (underlying data field) | Description | Report Pages |
| Age Over 25 | SID → SID_PERSON_DEMO → BIRTH_YYYYMM_DT | Indicator if a student is above 25 years of age | All Tabs |
| Benchmark | SID → SID_ENROLLMENTS → BENCH | Benchmark such as Preliminary or Final | All Benchmark Report Tabs |
| Budget Entity | SID → SID_ENROLLMENTS → BE_CD | Budget entity such as E & G or Health Sciences | All Tabs |
| Campus | SID → SID_ENROLLMENTS → HOMECAMPUS | The Campus at the time of Enrollment | All Tabs |
| CIP | SID → SID_ENROLLMENTS → CIP_STUDENT | All Tabs | |
| College | SID → SID_ENROLLMENTS → GLOBAL_COLLEGE | The Global College at the time of Enrollment | All Tabs |
| Department | SID → SID_ENROLLMENTS → GLOBAL_DEPT | The Global Department at the time of Enrollment | All Tabs |
| Ethnicity | SID → SID_ENROLLMENTS → ETHNIC | The Ethnicity at the time of Enrollment | All Tabs |
| First Generation | SID → SID_ENROLLMENTS → FIRSTGEN | Self-reported first generation students. | All Tabs |
| Full Time Indicator | SID → SID_ENROLLMENTS → CURR_TERM_CRS_LOAD | If the student is full time or part time based on the credit hours for the term. For Fall and Spring terms, UG students enrolled in >= 12 credits are considered full-time and GR students enrolled >= 9 credits are considered full-time. For Summer term, UG students enrolled in >= 9 credits are considered full-time and GR students enrolled >= 6 credits are considered full-time. | All Tabs |
| Gender | SID → SID_ENROLLMENTS → GENDER | The Gender at the time of Enrollment | All Tabs |
| Honors | SID → SID_ENROLLMENTS → HONORS | The Honors Student Status | All Tabs |
| New/Returning | SID → SID_ENROLLMENTS → STU_RECENT_ADM_DT | If the student is a New student or Returning from the previous term. If the Recent admit date is same as the Termid, then student is New else the student is Returning. | All Tabs |
| Residency | SID → SID_ENROLLMENTS →ETHNIC and FEE_CLASS_RES | The Residency Status at the time of Enrollment. The logic is below: When Ethnic = 'O' Then 'International' | All Tabs |
| Semester | SID → SID_TERMID → MONTH | Semester such as Fall, Spring or Summer | All Tabs |
| Student Classification | SID → SID_ENROLLMENTS → STU_CLASS_LEVEL | Student Classification such as Lower Level, Upper Level, Grad I and Grad II. The logic is below: When Stu_Class_Level = 'A' Then 'Grad II' | All Tabs |
| Student Level | SID → SID_ENROLLMENTS → STU_CLASS_LEVEL | Student level such as Undergraduate or Graduate. The logic is below: When STU_CLASS_LEVEL ='N' Then 'Non-Degree Seeking' | All Tabs |
| Student Type | SID → SID_ENROLLMENTS → STU_RECENT_ADM_TYP | Student Type such as FTIC or Masters | All Tabs |
| Term | SID → SID_ENROLLMENTS → TERMID | Term such as Fall 2020 or Spring 2018 | All Tabs |
Filter Panel
Filters are listed on the side panel of the report.
Notes:
- Click the down arrow to select from options in the filters and narrow down your results.
- To deselect an item, click on the option again.
- Some filters are radio buttons and you can select only one item. The items in these filters are indicated as round buttons.
- Some filters allow multiple selections. To select multiple values in a filter, select the square boxes
.
Data Panel
This panel displays the filtered results. To work with data in this panel:
- Select an individual row in the table to highlight the item/row. Select it again to return to the full table view.
- You can sort the data by column values, if the sorting is available for that column. Hover your mouse over the last row item in the column header and if a small black triangle appears, you can sort that column in ascending or descending order by clicking on your mouse.
Options for the Data Panel
Export Data to Excel
To export the data results to Excel, hover your mouse over the upper right hand side corner of the data table and a horizontal menu bar  will pop up. Click the
 ![]() in the top right corner .
in the top right corner .
A drop down menu will appear with 'Export data' as one of the options. Select Export Data to work with the data in Excel.
Note : The exported data in Excel may not look exactly like the screen.
![]()
Focus Mode
To see the data in Focus Mode, hover your mouse over the upper right hand side corner of the data table and a horizontal menu bar will pop up. Click the option for Focus Mode ![]() It allows the visual to take the entire space in the report canvas. Full screen mode will persist until you exit out or click on
It allows the visual to take the entire space in the report canvas. Full screen mode will persist until you exit out or click on  on the top left hand side.
When in Focus Mode, click the ![]() in the top right corner and a drop down menu will appear with the following options:
in the top right corner and a drop down menu will appear with the following options:
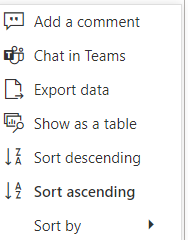
You can export data, or see the data in a table by selecting the appropriate option.
Spotlight
Spotlight causes all other visuals on the page to fade so the selected visual is highlighted. To highlight a visual, click on more action ![]() and select
and select 
Filters/Slicers on a visual
To find out what are the filters on any particular visual, select that visual and on the top right hand side, a menu bar of options will appear. There will be an option that looks like Filter on three horizonal bars, and if you select that, you can see what slicers are impacting that visual. Currently this menu bar is not available for Line Charts.
Matrix Visual: Drill Up and Drill Down
If the visual has the hierarchy, the  menu will appear when you hover on the top left side of the visual. Turn on drill down first by selecting the downward arrow. The grey background
 ![]() lets you know that drill down is active. Selecting
lets you know that drill down is active. Selecting ![]() will expand another level of hierarchy. Selecting the double arrow
will expand another level of hierarchy. Selecting the double arrow ![]() drill-down icon takes you to the next level in the hierarchy. Selecting
drill-down icon takes you to the next level in the hierarchy. Selecting ![]() will take you one level up in hierarchy. The arrows will be greyed out if the option is not available.
will take you one level up in hierarchy. The arrows will be greyed out if the option is not available.
Reset to Default
If you have made any changes, such as implementing filters or sorting the table, you have the ability to return the sorting and filtering to the report creator's default view. Click the Reset to Default image above the report in the Report Header: ![]()