SSRA Doctoral Research Student Success Dashboard
- Shruti Kumar
- Ayesha Abdul Majeed (Deactivated)
- Kevin Meleedy
Doctoral Research Student Success Dashboard
This report provides student success metrics for Doctoral Research students.
Data Source: SID
Refresh schedule: Every semester. The “Last Refreshed” timestamp on each page indicates the time when the data was last refreshed.
- PHD Graduation Rate by Cohort and College
Shows percentage of students who graduated each year by Cohort and College.
- PHD Graduation Rate by Cohort and Department
Shows percentage of students who graduated each year by Cohort, College, and Department.
- PHD Graduation Rate by College and Year
Shows percentage of students who graduated each year of the selected Cohort by College.
- PHD Graduation Rate by Department and Year
Shows the percentage of students who graduated each year for the selected Cohort by College.
- PHD Student Success Snapshot by College
For the purpose of this report, all doctorate seeking students in admitted to the college in the Cohort Year were divided into the below categories:
- Completed PhD are students who graduated with a PhD
- Completed MS and PhD are students who graduated with a Masters and also graduated with a PhD
- Completed MS but dropped PhD are students who graduated with a Masters and also graduated with a PhD
- PHD Student Success Snapshot by Department
For the purpose of this report, all doctorate seeking students in admitted to the college in the Cohort Year were divided into the below categories:
- Completed PhD are students who graduated with a PhD
- Completed MS and PhD are students who graduated with a Masters and also graduated with a PhD
- Completed MS but dropped PhD are students who graduated with a Masters and also graduated with a PhD
- PHD Dropout Analysis by College
Shows the median time after which a student dropped out for the different college for PHD Cohorts 2008 through 2012.
- PHD Dropout Analysis by Department
Shows the median time after which a student dropped out for the different college for PHD Cohorts 2008 through 2012.
- PHD Median Time To Reach Candidacy by College
Shows the median time to reach candidacy and time to graduate after candidacy for different colleges for PHD Cohorts 2008 through 2012.
- Compare PHD Median Time To Reach Candidacy by College
Shows the median time to reach candidacy and time to graduate after candidacy for different college for PHD Cohorts 2008 through 2012.
- Compare PHD Median Time To Reach Candidacy by Department
Shows median time to reach candidacy and time to graduate after candidacy for different colleges for PHD Cohorts 2008 through 2012.
| Data Element | Description | Report Pages |
|---|---|---|
Cohort | Identifies the Academic Year the student was admitted in | PHD Graduation Rate by Cohort and Department |
Campus | Identifies student's home campus of registration | Graduate FTE by College Graduate Headcount by College and Dept |
Academic Year | Academic Year consists of the Fall, Spring, Summer terms for the purpose of this dashboard as most graduate programs have Fall starts | PHD Student Success Snapshot by College- PHD Student Success Snapshot by Department- |
College | College is based on Global College crosswalk post consolidation in 2020 | PHD Graduation Rate by Cohort and College Graduate FTE by College and Dept Student Success Snapshot by Department Graduate FTE by College and Dept PHD Student Success Snapshot by College- PHD Dropout Analysis Time To Reach Candidacy by College Compare PHD Median Time To Reach Candidacy by College Compare PHD Median Time To Reach Candidacy by Department |
Department | Department is based on Global Department post consolidation in 2020 | PHD Graduation Rate by Department and Year Graduate FTE by College and Dept Graduate Headcount by College and Dept PHD Student Success Snapshot by Department- PHD Dropout Analysis Compare PHD Median Time To Reach Candidacy by Department |
Filter Panel
If filters are available, filter panel will be on top or left of data panel. All pages may not have filter panel.
Notes:
- Click the down arrow to select from options in the filters and narrow down your results.
- To deselect an item, click on the option again.
- Some filters are radio buttons and you can select only one item. The items in these filters are indicated as round buttons
 .
. - Some filters allow multiple selections. To select multiples in a filter, hold the Ctrl key as you check the square boxes
.
- Filters for the report may not have Blank as an option.
Data Panel
Data panel displays the filtered results. To work with data in this panel:
- Select an individual row in the table to highlight the item/row. Select it again to return to the full table view.
- You can sort the data by column values, if the sorting is available for that column. Hover your mouse over the last row item in the column header and if a small black triangle appears
 , you can sort that column in ascending or descending order by clicking on your mouse.
Select a column header to sort by that value, such as Campus.
Tasks
Export Data to Excel
To export the data results to Excel, hover your mouse over the upper right hand side corner of the data table and a horizontal menu bar  will pop up. Click the
 ![]() in the top right corner .
in the top right corner .
A drop down menu will appear with 'Export data' as one of the options. Select Export Data to work with the data in Excel.
Note : The exported data in Excel may not look exactly like the screen.
![]()
Drill through
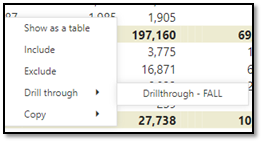
To 'Drill through', right click on a data cell in the data table. A menu will pop up with 'Drill Through" as one of the options. Selecting drill-though option will open another window with the details.
Note : All data tables may not have 'Drill through' functionality.
Reset to Default
If you have made any changes, such as implementing filters or sorting the table, you have the ability to return the sorting and filtering to the report creator's default view. Click the Reset to Default image in the Report Header: ![]()