Percent of Bachelor's Degrees Without Excess Hours
Percent of Bachelor's Degrees Without Excess Hours
Percent of Bachelor's Degrees Without Excess Hours report provides information on the percentage of baccalaureate degrees awarded within 110% of the credit hours required for a degree based on the Board of Governors Academic Program Inventory. This metric excludes the following types of student credits: accelerated mechanisms, remedial coursework, non-native credit hours that are not used toward the degree, non-native credit hours from failed, incomplete, withdrawn, or repeated courses, credit hours from internship programs, credit hours up to 10 foreign language credit hours, and credit hours earned in military science courses that are part of the Reserve Officers’ Training Corps (ROTC) program. Starting in 2018-19, the calculation for this metric included a new type of statutory exclusion of up to 12 credit hours for students who graduated in four years or less. This metric does not report the number of students who paid the “Excess Hour Surcharge” (Section 1009.286, Florida Statutes).
This is a academic year metric (Summer + Fall + Spring).
Data Source: SID
Refresh Schedule: Data is refreshed once for every semester. "The data is current as of " indicates when the data is extracted from SID.
Percent of Bachelor's Degrees Without Excess Hours
- Percent of Bachelor's Degrees Without Excess Hours → The tab displays the Percent of Bachelor's Degrees Without Excess Hours in various colleges for the past 5 years in a tabular form.
- Percent of Bachelor's Degrees Without Excess Hours Trend → The tab displays the Percent of Bachelor's Degrees Without Excess Hours trend in various colleges for the past 5 years in a line chart.
Filters on the Filters Panel
There is a filter panel on the right which can be expanded or collapsed using the >> button. The filter panel has following filters:
- College
- College Group - Colleges are grouped under academic affairs, health and others.
Data Element | Data Source (underlying data field) | Description | Report Pages |
| Degree Global College | EIS Student CUBE - Degree Awarded | College that awarded the degree. | All Pages |
| Year Academic | EIS Student CUBE - Degree Awarded | Academic year as identified by Summer + Fall + Spring. | All Pages |
| Flag Valid PBF Excess Hours Degree | EIS Student CUBE - Degree Awarded | Identifies if the particular degree can count towards the generation of excess hours. To be used when computing excess hours. | All Pages |
| Count Degree Awarded | EIS Student CUBE - Degree Awarded | Count of degrees awarded. | All Pages |
| PBF Excess Hours Student Count | EIS Student CUBE - Degree Awarded | Count of students with excess hours. | All Pages |
Filter Panel
Filters are listed on the side panel of the report.
Notes:
- Click the down arrow to select from options in the filters and narrow down your results.
- To deselect an item, click on the option again.
- Some filters are radio buttons and you can select only one item. The items in these filters are indicated as round buttons .
- Some filters allow multiple selections. To select multiple values in a filter, select the square boxes
.
Data Panel
This panel displays the filtered results. To work with data in this panel:
- Select an individual row in the table to highlight the item/row. Select it again to return to the full table view.
- You can sort the data by column values, if the sorting is available for that column. Hover your mouse over the last row item in the column header and if a small black triangle appears, you can sort that column in ascending or descending order by clicking on your mouse.
Options for the Data Panel
Export Data to Excel
To export the data results to Excel, hover your mouse over the upper right hand side corner of the data table and a horizontal menu bar 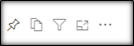 will pop up. Click the
 ![]() in the top right corner .
in the top right corner .
A drop down menu will appear with 'Export data' as one of the options. Select Export Data to work with the data in Excel.
Note : The exported data in Excel may not look exactly like the screen.
![]()
Focus Mode
To see the data in Focus Mode, hover your mouse over the upper right hand side corner of the data table and a horizontal menu bar will pop up. Click the option for Focus Mode ![]() It allows the visual to take the entire space in the report canvas. Full screen mode will persist until you exit out or click on
It allows the visual to take the entire space in the report canvas. Full screen mode will persist until you exit out or click on  on the top left hand side.
When in Focus Mode, click the ![]() in the top right corner and a drop down menu will appear with the following options:
in the top right corner and a drop down menu will appear with the following options:
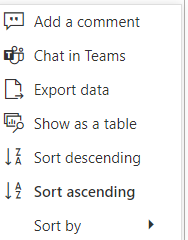
You can export data, or see the data in a table by selecting the appropriate option.
Spotlight
Spotlight causes all other visuals on the page to fade so the selected visual is highlighted. To highlight a visual, click on more action ![]() and select
and select 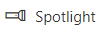
Filters/Slicers on a visual
To find out what are the filters on any particular visual, select that visual and on the top right hand side, a menu bar of options will appear. There will be an option that looks like Filter on three horizonal bars, and if you select that, you can see what slicers are impacting that visual. Currently this menu bar is not available for Line Charts.
Matrix Visual: Drill Up and Drill Down
If the visual has the hierarchy, the  menu will appear when you hover on the top left side of the visual. Turn on drill down first by selecting the downward arrow. The grey background
 ![]() lets you know that drill down is active. Selecting
lets you know that drill down is active. Selecting ![]() will expand another level of hierarchy. Selecting the double arrow
will expand another level of hierarchy. Selecting the double arrow ![]() drill-down icon takes you to the next level in the hierarchy. Selecting
drill-down icon takes you to the next level in the hierarchy. Selecting ![]() will take you one level up in hierarchy. The arrows will be greyed out if the option is not available.
will take you one level up in hierarchy. The arrows will be greyed out if the option is not available.
Reset to Default
If you have made any changes, such as implementing filters or sorting the table, you have the ability to return the sorting and filtering to the report creator's default view. Click the Reset to Default image above the report in the Report Header: ![]()