Undergraduate Class Sections
Undergraduate Class Sections aligns with that of the Common Data Set Initiative (www.commondataset.org). In sum, a class section is defined as an organized undergraduate course offered for credit, identified by discipline and number, meeting at a stated time or times in a classroom or similar setting, and not a subsection such as a laboratory or discussion session. Excludes distance learning classes and noncredit classes and individual instruction such as dissertation or thesis research, music instruction, or one‐to‐one readings. The number of class sections with the number of students ranging from 2 to 9, 10-19, 20 to 29, 30 to 39, 40 to 49, 50-99,100 and more are listed in this metric.
This is a Fall metric.
Data Source: SID
Refresh Schedule: Data is refreshed for fall term only. "The data is current as of" depicts when the data is extracted from SID.
Undergraduate Class Sections
- UG Class Sections → The tab displays the number of UG class sections in each college for the past 5 years in a tabular form. To view particular class size and college, slicers can be used.
- UG Class Sections Trend (% of College) → The tab displays the number of UG class sections trend by % of college for the past 5 years in a line chart. To view particular class size and college, slicers can be used.
- UG Class Sections Trend (% of USF) → The tab displays the number of UG class sections trend by % of USF for the past 5 years in a line chart. To view particular class size and college, slicers can be used.
- UG Class Sections All → The tab displays the number of UG class sections in each class size for the past 5 years in a tabular form. To view particular class size and college, slicers can be used.
- UG Class Sections All Trend (% of College) → The tab displays the number of UG class sections in each class size by % of college for the past 5 years in a line chart. To view particular class size and college, slicers can be used.
- UG Class Sections All Trend (% of USF) → The tab displays the number of UG class sections in each class size by % of USF for the past 5 years in a line chart. To view particular class size and college, slicers can be used.
Filters on the Filters Panel
There is a filter panel on the right which can be expanded or collapsed using the >> button. The filter panel has following filters:
- College
- College Group - Colleges are grouped under academic affairs, health and others.
Data Element | Data Source (underlying data field) | Description | Report Pages |
Filter Panel
Filters are listed on the side panel of the report.
Notes:
- Click the down arrow to select from options in the filters and narrow down your results.
- To deselect an item, click on the option again.
- Some filters are radio buttons and you can select only one item. The items in these filters are indicated as round buttons
 .
. - Some filters allow multiple selections. To select multiple values in a filter, select the square boxes
.
Data Panel
This panel displays the filtered results. To work with data in this panel:
- Select an individual row in the table to highlight the item/row. Select it again to return to the full table view.
- You can sort the data by column values, if the sorting is available for that column. Hover your mouse over the last row item in the column header and if a small black triangle appears
 , you can sort that column in ascending or descending order by clicking on your mouse.
Options for the Data Panel
Export Data to Excel
To export the data results to Excel, hover your mouse over the upper right hand side corner of the data table and a horizontal menu bar  will pop up. Click the
 ![]() in the top right corner .
in the top right corner .
A drop down menu will appear with 'Export data' as one of the options. Select Export Data to work with the data in Excel.
Note : The exported data in Excel may not look exactly like the screen.
![]()
Focus Mode
To see the data in Focus Mode, hover your mouse over the upper right hand side corner of the data table and a horizontal menu bar will pop up. Click the option for Focus Mode ![]() It allows the visual to take the entire space in the report canvas. Full screen mode will persist until you exit out or click on
It allows the visual to take the entire space in the report canvas. Full screen mode will persist until you exit out or click on  on the top left hand side.
When in Focus Mode, click the ![]() in the top right corner and a drop down menu will appear with the following options:
in the top right corner and a drop down menu will appear with the following options:
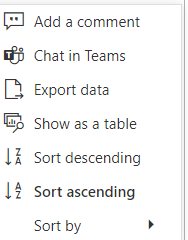
You can export data, or see the data in a table by selecting the appropriate option.
Spotlight
Spotlight causes all other visuals on the page to fade so the selected visual is highlighted. To highlight a visual, click on more action ![]() and select
and select 
Filters/Slicers on a visual
To find out what are the filters on any particular visual, select that visual and on the top right hand side, a menu bar of options will appear. There will be an option that looks like Filter on three horizonal bars, and if you select that, you can see what slicers are impacting that visual. Currently this menu bar is not available for Line Charts.
Matrix Visual: Drill Up and Drill Down
If the visual has the hierarchy, the 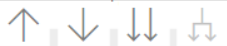 menu will appear when you hover on the top left side of the visual. Turn on drill down first by selecting the downward arrow. The grey background
 ![]() lets you know that drill down is active. Selecting
lets you know that drill down is active. Selecting ![]() will expand another level of hierarchy. Selecting the double arrow
will expand another level of hierarchy. Selecting the double arrow ![]() drill-down icon takes you to the next level in the hierarchy. Selecting
drill-down icon takes you to the next level in the hierarchy. Selecting ![]() will take you one level up in hierarchy. The arrows will be greyed out if the option is not available.
will take you one level up in hierarchy. The arrows will be greyed out if the option is not available.
Reset to Default
If you have made any changes, such as implementing filters or sorting the table, you have the ability to return the sorting and filtering to the report creator's default view. Click the Reset to Default image above the report in the Report Header: ![]()