Average High School GPA and SAT Scores for Incoming Freshmen (Fall)
- Xiaoying Liu
- Sangita Singh
- Hennadii Balashov
Average GPA & Average SAT:
An average weighted grade point average of 4.0 or higher and an average SAT score of 1200 or higher for fall semester incoming freshmen, as reported annually in the admissions data that universities submit to the Board of Governors. This data includes registered FTIC (student type='B’, ‘E') with an admission action of admitted or provisionally admitted ('A', 'P', 'X'). Source: State University Database System (SUDS).
Methodology: Following 2020 Florida legislation, the concorded SAT score for students who submit both SAT and ACT subscores is the highest (superscore) for a single test subsection. This methodology is used for Preeminent metrics and reported in the annual SUS Accountability Plan.
Data Source: SID
Refresh schedule: Data is refreshed annually at preliminary benchmark for fall term. The “Data as of” field indicates when the data was extracted from SID.
- Avg GPA and SAT → Table view displays the average high school GPA and SAT scores for each college for the past 5 fall semesters.
- Avg GPA Trend → Graph view displays the 5 semester trend on average high school GPA for incoming freshmen.
- Avg SAT Score Trend → Graph view displays the 5 semester trend on average SAT score for incoming freshmen.
Data Element | Data Source (underlying data field) | Description | Report Pages |
| College | SID → SID_ENROLLMENTS → GLOBAL_COLLEGE | Students' enrolled Global College for the fall term. | All Pages |
| Academic Year | SID → SID_TERMID → ACADYEAR | Academic Year. | All Pages |
| HS GPA | SID → SID_APPLICANTS_ADMITS → GPA_HIGH_SCHOOL | High School GPA. | All Pages |
| SAT | SID → SID_APPLICANTS_ADMITS → TEST_SCORE_N | SAS Score or Converted ACT Score. | All Pages |
Filter Panels
Filters are listed on top panel of the report.
Notes:
- Click the down arrow to select from options in the filters and narrow down your results.
- To deselect an item, click on the option again.
- Some filters are radio buttons and you can select only one item. The items in these filters are indicated as round buttons.
- Some filters allow multiple selections. To select multiple values in a filter, hold the Ctrl key as you check the square boxes
.
- Filters for the report may not have Blank as an option.
Data Panel
This panel displays the filtered results. To work with data in this panel:
- Select an individual row in the table to highlight the item/row. Select it again to return to the full table view.
- You can sort the data by column values, if the sorting is available for that column. Hover your mouse over the last row item in the column header and if a small black triangle appears, you can sort that column in ascending or descending order by clicking on your mouse.
Options for the Data Panel
Export Data to Excel
To export the data results to Excel, hover your mouse over the upper right hand side corner of the data table and a horizontal menu bar 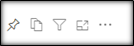 will pop up. Click the
 ![]() in the top right corner .
in the top right corner .
A drop down menu will appear with 'Export data' as one of the options. Select Export Data to work with the data in Excel.
Note : The exported data in Excel may not look exactly like the screen.
![]()
Focus Mode
To see the data in Focus Mode, hover your mouse over the upper right hand side corner of the data table and a horizontal menu bar will pop up. Click the option for Focus Mode ![]() It allows the visual to take the entire space in the report canvas. Full screen mode will persist until you exit out or click on
It allows the visual to take the entire space in the report canvas. Full screen mode will persist until you exit out or click on  on the top left hand side.
When in Focus Mode, click the ![]() in the top right corner and a drop down menu will appear with the following options:
in the top right corner and a drop down menu will appear with the following options:
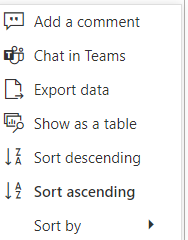
You can export data, or see the data in a table by selecting the appropriate option.
Spotlight
Spotlight causes all other visuals on the page to fade so the selected visual is highlighted. To highlight a visual, click on more action ![]() and select
and select 
Drill Up and Drill Down
If the visual has the hierarchy, the  menu will appear when you hover on the top left side of the visual. Turn on drill down first by selecting the downward arrow. The grey background
 ![]() lets you know that drill down is active. Selecting
lets you know that drill down is active. Selecting ![]() will expand another level of hierarchy. Selecting the double arrow
will expand another level of hierarchy. Selecting the double arrow ![]() drill-down icon takes you to the next level in the hierarchy. Selecting
drill-down icon takes you to the next level in the hierarchy. Selecting ![]() will take you one level up in hierarchy. The arrows will be greyed out if the option is not available.
will take you one level up in hierarchy. The arrows will be greyed out if the option is not available.
Reset to Default
If you have made any changes, such as implementing filters or sorting the table, you have the ability to return the sorting and filtering to the report creator's default view. Click the Reset to Default image above the report in the Report Header: ![]()