Student Awards
- Sangita Singh
- Penchala Akshay Kumar Kandagaddala
- Himaja Maddika
Student Awards
Student Awards report provide information about the number of institutional-affiliated students per calendar year who receive awards from prominent grant and fellowship programs in the arts, humanities, science, engineering, and health fields as reported by The Center's Top American Research Universities (TARU). The number reported is for the academic year that preceded the reporting year.
The number of student awards is a membership eligibility requirement for the Association of American Universities (AAU). A list of the awards considered by the AAU is available in the AAU's Membership Policy.
Student Awards is an Academic Year (Fall + Spring + Summer) metric.
Data Source: Office of National Scholars
Refresh Schedule: Data is refreshed twice for every academic year in December and June. "Data as of " indicates when the data is extracted from Office of National Scholars.
Student Awards
- Student Awards by College→ The tab displays the number of awards received by students in various colleges over the past 5 years in a tabular form. The tab has slicers for program and award. By default, the slicers are selected to display all the programs and awards.
- Student Awards by College Trend → The tab displays the trend in the number of awards received by students across various colleges over the past 5 years in a line chart. By default, it shows the data for all the programs and all the awards. The tab has slicers for program and award.
- Student Awards List → The tab displays comprehensive information about the awards received by each student over the past 5 years, the estimated amount of grants received along with the student level in a tabular form. The tab has the slicer for Academic year, college, program and award name.
- Student Awards by Program → The tab displays the distinct count of programs available over the past 5 years along with the cumulative estimated amount of grant received from each program. The tab has the slicer for College and Award.
- Student Awards by Award Name → The tab displays the count of awards received over the past 5 years along with the estimated amount of grant for that award. The tab has the slicer for college and program.
Filters on the Filters Panel
There is a filter panel on the right which can be expanded or collapsed using the >> button. The filter panel has following filters:
- College
- College Group - Colleges are grouped under academic affairs, health and others.
- Student Level - Students are classified into Alumni, Graduate and Undergraduate.
- Program - Name of the program
- Award Name - Name of the Award.
Data Element | Data Source (underlying data field) | Description | Report Pages |
| College | SID → SID_ENROLLMENTS → GLOBAL_COLLEGE | The Global College at the time of Enrollment | All Tabs |
| College Group | The College Group at the time of Enrollment | All Tabs | |
| Student Level | Students are classified into Alumni, GR, UG | All Tabs | |
| Program | Name of the Program | All Tabs | |
| Award Name | Name of the Award | All Tabs |
Filter Panel
Filters are listed on the side panel of the report.
Notes:
- Click the down arrow to select from options in the filters and narrow down your results.
- To deselect an item, click on the option again.
- Some filters are radio buttons and you can select only one item. The items in these filters are indicated as round buttons.
- Some filters allow multiple selections. To select multiple values in a filter, select the square boxes
.
Data Panel
This panel displays the filtered results. To work with data in this panel:
- Select an individual row in the table to highlight the item/row. Select it again to return to the full table view.
- You can sort the data by column values, if the sorting is available for that column. Hover your mouse over the last row item in the column header and if a small black triangle appears, you can sort that column in ascending or descending order by clicking on your mouse.
Options for the Data Panel
Export Data to Excel
To export the data results to Excel, hover your mouse over the upper right hand side corner of the data table and a horizontal menu bar  will pop up. Click the
 ![]() in the top right corner .
in the top right corner .
A drop down menu will appear with 'Export data' as one of the options. Select Export Data to work with the data in Excel.
Note : The exported data in Excel may not look exactly like the screen.
![]()
Focus Mode
To see the data in Focus Mode, hover your mouse over the upper right hand side corner of the data table and a horizontal menu bar will pop up. Click the option for Focus Mode ![]() It allows the visual to take the entire space in the report canvas. Full screen mode will persist until you exit out or click on
It allows the visual to take the entire space in the report canvas. Full screen mode will persist until you exit out or click on  on the top left hand side.
When in Focus Mode, click the ![]() in the top right corner and a drop down menu will appear with the following options:
in the top right corner and a drop down menu will appear with the following options:
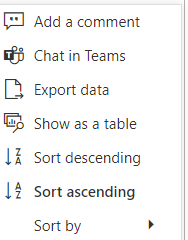
You can export data, or see the data in a table by selecting the appropriate option.
Spotlight
Spotlight causes all other visuals on the page to fade so the selected visual is highlighted. To highlight a visual, click on more action ![]() and select
and select 
Filters/Slicers on a visual
To find out what are the filters on any particular visual, select that visual and on the top right hand side, a menu bar of options will appear. There will be an option that looks like Filter on three horizonal bars, and if you select that, you can see what slicers are impacting that visual. Currently this menu bar is not available for Line Charts.
Matrix Visual: Drill Up and Drill Down
If the visual has the hierarchy, the  menu will appear when you hover on the top left side of the visual. Turn on drill down first by selecting the downward arrow. The grey background
 ![]() lets you know that drill down is active. Selecting
lets you know that drill down is active. Selecting ![]() will expand another level of hierarchy. Selecting the double arrow
will expand another level of hierarchy. Selecting the double arrow ![]() drill-down icon takes you to the next level in the hierarchy. Selecting
drill-down icon takes you to the next level in the hierarchy. Selecting ![]() will take you one level up in hierarchy. The arrows will be greyed out if the option is not available.
will take you one level up in hierarchy. The arrows will be greyed out if the option is not available.
Reset to Default
If you have made any changes, such as implementing filters or sorting the table, you have the ability to return the sorting and filtering to the report creator's default view. Click the Reset to Default image above the report in the Report Header: ![]()