Gross and Fundable FTE
- Sangita Singh
- Mounica Pothureddy
- Hennadii Balashov
Gross and Fundable FTE
FTE stands for Full-Time Equivalent, which is a single value providing a meaningful combination of full-time and part-time students.
Gross FTE is a measure of all instructional activity (regardless of fundability) that is based on the number of credit hours for all students during an academic (summer, fall, spring) year. FTE is based on the standard national definition, which divides undergraduate credit hours by 40 (Fall and Spring:15, Summer:10) and graduate credit hours by 32 (Fall and Spring: 12, Summer: 8).
Fundable FTE is calculated from the student credit hours for which the university receives funding. For example: Courses that are not funded include: remedial courses, military courses, courses paid from non-University sources (third-party), audited SCH, repeat surcharge applied courses, employee and senior citizen waivers etc.
This is a academic year metric (Summer + Fall + Spring).
Data Source: SID (Cubes)
Refresh Schedule: The data is refreshed 12 times per academic year, for all three semesters and for all four benches. "Data as of " indicates when the data is extracted from SID.
Gross FTE
- Total FTE → The tab displays the number of credit hours students enrolled by course level in the various campuses, colleges, and departments for the past 5 years in a tabular form for Gross and Fundable FTE. The Gross FTE field in the report is mapped to Gross Federal FTE Student field in the cubes and it should not be confused with Gross FTE field in the cube.
- Total Gross FTE Trend → The tab displays number of credit hours students enrolled by course level trend in the various campuses, colleges, and departments for the past 5 years in a line chart.
- Total Fundable FTE Trend → The tab displays number of credit hours students enrolled by course level trend in the various campuses, colleges, and departments for the past 5 years in a line chart.
- Undergraduate Gross FTE → The tab displays the number of lower and upper level undergraduate FTE students in the various campuses, colleges, and departments for the past 5 years in a tabular form.
- Undergraduate Lower Level Gross FTE Trend → The tab displays the number of students who has earned less than 60 credit hours, or a student who has not been admitted to the upper division in a line chart.
- Undergraduate Upper Level Gross FTE Trend → The tab displays the number of students who has earned 60 or more credit hours or has an associate of arts degree and has completed requirements in English and Mathematics as prescribed by FAC 6A -10.030 or is working toward an additional baccalaureate degree in a line chart.
- Graduate Gross FTE → The tab displays the number of Grad I and Grad II students who has been formally admitted to a graduate degree program and is not an advanced graduate student in a tabular form.
- Graduate Beginner Level Gross FTE Trend → The tab displays the number of graduate students who has been formally admitted to a graduate degree program and is not an advanced graduate student.
- Graduate Advanced Level Gross FTE Trend → The tab displays the number of graduate students who has been formally admitted to a recognized Doctoral or Post - Masters's degree program.
- Distance Learning Gross FTE → The tab displays the number of all distance learning and primarily distance learning students in tabular form.
- Distance learning Gross FTE Trend → The tab displays the number of all distance learning and primarily distance learning students trend in line chart.
- Course Level Gross FTE → The tab displays the number of students enrolled by college level and by delivery method in tabular form.
- Course Level Gross FTE Trend → The tab displays the number of students enrolled by college level and by delivery method in line chart.
Filters on the Filters Panel
There is a filter panel on the right which can be expanded or collapsed using the >> button. The filter panel has following filters:
- Campus
- CIP
- College Group
- Course College
- Course Department
- Course Group
- Course Level
- Delivery Method
- Gender
- Major
- Race/Ethnicity
Data Element | Data Source (underlying data field) | Description | Report Pages |
Campus | EIS Student CUBE - Registration | All Tabs | |
| CIP | EIS Student CUBE - Registration | All Tabs | |
| College Group | The College Group at the time of Enrollment | All Tabs | |
Course College | EIS Student CUBE - Registration | The Global College at the time of Enrollment | All Tabs |
Course Department | EIS Student CUBE - Registration | All Tabs | |
Course Group | EIS Student CUBE - Registration | 1, 4, 5, 6 | |
Course Level | EIS Student CUBE - Registration | All Tabs | |
Delivery Method | EIS Student CUBE - Registration | All Tabs | |
Gender | EIS Student CUBE - Registration | All Tabs | |
Major | EIS Student CUBE - Registration | All Tabs | |
Race/Ethnicity | EIS Student CUBE - Registration | All Tabs |
Filter Panel
Filters are listed on the side panel of the report.
Notes:
- Click the down arrow to select from options in the filters and narrow down your results.
- To deselect an item, click on the option again.
- Some filters are radio buttons and you can select only one item. The items in these filters are indicated as round buttons.
- Some filters allow multiple selections. To select multiple values in a filter, select the square boxes
.
Data Panel
This panel displays the filtered results. To work with data in this panel:
- Select an individual row in the table to highlight the item/row. Select it again to return to the full table view.
- You can sort the data by column values, if the sorting is available for that column. Hover your mouse over the last row item in the column header and if a small black triangle appears, you can sort that column in ascending or descending order by clicking on your mouse.
Options for the Data Panel
Export Data to Excel
To export the data results to Excel, hover your mouse over the upper right hand side corner of the data table and a horizontal menu bar  will pop up. Click the
 ![]() in the top right corner .
in the top right corner .
A drop down menu will appear with 'Export data' as one of the options. Select Export Data to work with the data in Excel.
Note : The exported data in Excel may not look exactly like the screen.
![]()
Focus Mode
To see the data in Focus Mode, hover your mouse over the upper right hand side corner of the data table and a horizontal menu bar will pop up. Click the option for Focus Mode ![]() It allows the visual to take the entire space in the report canvas. Full screen mode will persist until you exit out or click on
It allows the visual to take the entire space in the report canvas. Full screen mode will persist until you exit out or click on  on the top left hand side.
When in Focus Mode, click the ![]() in the top right corner and a drop down menu will appear with the following options:
in the top right corner and a drop down menu will appear with the following options:
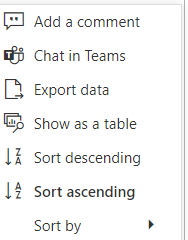
You can export data, or see the data in a table by selecting the appropriate option.
Spotlight
Spotlight causes all other visuals on the page to fade so the selected visual is highlighted. To highlight a visual, click on more action ![]() and select
and select 
Filters/Slicers on a visual
To find out what are the filters on any particular visual, select that visual and on the top right hand side, a menu bar of options will appear. There will be an option that looks like Filter on three horizonal bars, and if you select that, you can see what slicers are impacting that visual. Currently this menu bar is not available for Line Charts.
Matrix Visual: Drill Up and Drill Down
If the visual has the hierarchy, the 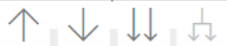 menu will appear when you hover on the top left side of the visual. Turn on drill down first by selecting the downward arrow. The grey background
 ![]() lets you know that drill down is active. Selecting
lets you know that drill down is active. Selecting ![]() will expand another level of hierarchy. Selecting the double arrow
will expand another level of hierarchy. Selecting the double arrow ![]() drill-down icon takes you to the next level in the hierarchy. Selecting
drill-down icon takes you to the next level in the hierarchy. Selecting ![]() will take you one level up in hierarchy. The arrows will be greyed out if the option is not available.
will take you one level up in hierarchy. The arrows will be greyed out if the option is not available.
Reset to Default
If you have made any changes, such as implementing filters or sorting the table, you have the ability to return the sorting and filtering to the report creator's default view. Click the Reset to Default image above the report in the Report Header: ![]()