Perform Data Drilling - Data and Analytics
- Lani Boothman-Carpenter (Deactivated)
- Jessica Marshall
- Dana Frederick
Report Drilling
When a report has drilling capabilities the drill tool may be turned on.
Identifying Drill in a Report
You can identify if a document you've opened has been enabled for drill in one of the following ways:
- Drill on the top toolbar appears selected.
- Drill Up Icon
 is present in section or column headings. See Figure 1 below.
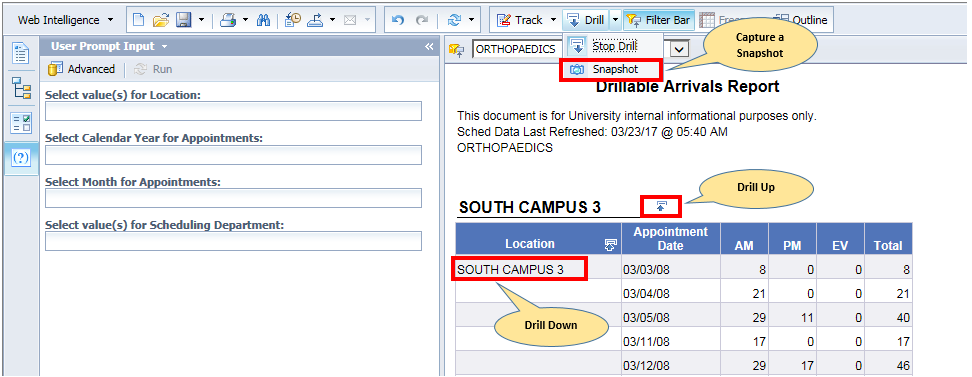
Figure 1: Drill on Report. Click image to enlarge.
Enabling/Disabling Drill in a Report (tab)
Even if Drill is not enabled when a Document is opened, drill may still be available. To enable Drill on a given report (tab):
- Click Drill on the top toolbar.
- The Filter Bar will appear under the top toolbar and Drill Up Icon
 will display in the body of the report.
To disable drill, click on Drill on the top toolbar.
Performing Drill in a Report (tab)
To drill down:
- Identify that the column or section is drillable by hovering over the data.
Underline will appear under the data and tooltip will appear stating "Drill Down to ...".
- Click on the data to drill down one level. See Figure 1 above.
- The data will adjust to the drill level.
- The drill-filter applied to the data will display in the filter bar. See Selecting Values for Objects in the Filter Bar
NOTE
When you have drilled to the lowest level, hovering over the data will display a tooltip stating "Drill Up to ...". Clicking on the data will drill up one level.
To drill up:
- Click the Drill Up Iconto drill up. See Figure 1 above.
- The data will adjust to the new drill level.
- The drill-filter removed from the displayed data disappears from the filter bar.
Selecting Values for the Object in the Filter Bar
- Click on the object's drop-down in the Filter Bar.
- Choose a value from the list. See Figure 3.
The page will automatically refresh and display data based on the value selected.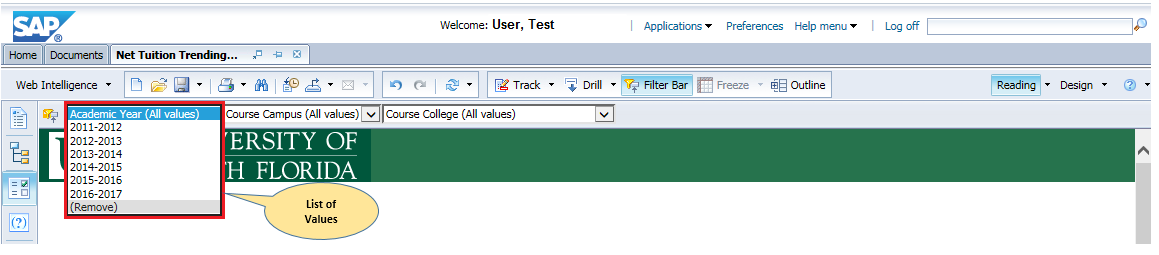
Figure 3: Object Values. Click image to enlarge.
Showing All Values
Removing Objects from the Filter Bar
Click on the object's drop-down in the Filter Bar.
Choose (Remove) from the value list. See Figure 3.
The drop-down for the object will disappear from the Filter Bar.
When drilling through a report, you can capture different levels of the report by using the Snapshot feature. These new tabs can be included in the export to Excel or PDF.
Follow these instructions to capture a snapshot:
- Click on the down arrow
 to the right of Drill in the top menu bar. See Figure 2 below.
 - Click on Snapshot.
A tab will be created with a snapshot of the report at it's current drill level.
You can continue to drill on the original tab and take snapshots to add more tabs.
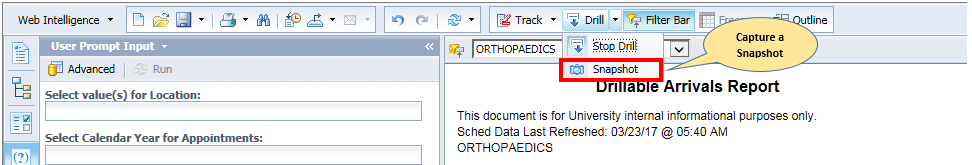
Figure 2: Snapshot. Click image to enlarge.