Intelligent Communication
- Sunitha Balasubramanian (Deactivated)
- Chukwuebuka Ezema
- Praveen Kumar Partheepan
Intelligent Communication Reports
The Intelligent Communication (IC) reports are a set of three interactive workspaces that provide the academic advising community (advisors, coordinators, supervisors, and leadership) with metrics they can use to measure the effectiveness of the university’s academic advising initiatives. Using the reports: IC - Advisor Summary, IC - Supervisor Summary, and IC - Drop-In Queue, users can view academic advising efforts in managing caseloads and improving student success through many perspectives, including the following:
- View appointment schedule timeline
- View students’ advisor appointment history
- View students who have not made appointments
- Compare appointments within a college
- Identify reasons for advisor appointments
- Gain insight into appointment cancellations
- View the utilization and capacity of advisors within a college
Note: Security permissions are set to enable sharing of this data to appropriate users, i.e., advisors can see only the metrics for their appointments, and supervisors can see those pertaining to all advisors.
The information below describes each of the IC reports, provides tips on navigation, and identifies common tasks you can use to view the data.
Click here → IC Advisor QRG for a guide showing tips on using and navigating the IC reports.
Report Elements Glossary Table
Report: IC - Advisor Summary |
|---|
The IC – Advisor Summary provides a dashboard for individual advisors displaying diagrams and charts of appointment data. Note that security permissions are set to enable viewing of this data according to permission level; that is, each advisor sees only the data pertaining to his or her appointments.
This report provides a summary of academic advisor appointments. The report consists of two panels: the left panel allows you to filter the data by elements, such as appointment outcome or date range; the right panel displays the appointment data in different visual formats with charts, graphs, and tables.
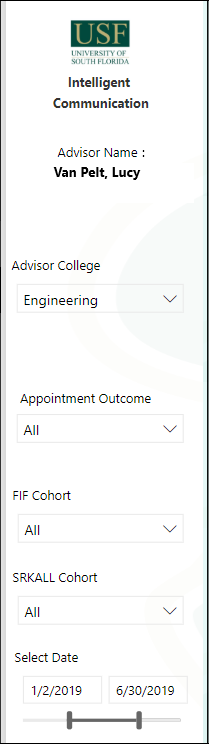
Filter Panel
The left panel allows you to filter the data that displays in the data panel. Select to filter by one or more of the following options:

- Advisor Name: The advisor name displays at the top of the filter panel. If a supervisor with permissions views this report, the Advisor Name shows a drop-down selection of advisors to choose from. You can select more than one advisor by holding the Ctrl key as you click advisor names.
- Advisor College: Select a college to view appointment data for that college; the list is filtered to show only the colleges associated with the advisor.
- Appointment Outcome: Select an appointment outcome among the following choices:
- Attended
- No Show
- SSP Canceled
- Student Canceled - Fault
- Student Canceled – No Fault
- Walk-in
- FIF Cohort: Select from the list of available FIF cohorts.
- SRKALL Cohort: Select from the list of available SRKALL cohorts.
- Select Date: Move the slider to select a date range or click in each date field to select from a calendar.
Data Panel
The panel on the right is the main workspace and consists of five sections. These sections are described in detail below.

Notes:
- The displays for these sections are interactive; that is, if you select a component in one display, the numbers in the other sections adjust accordingly.
- To select an item in the display, click the segment of the pie or bar chart. To return to the full display, click that same segment again.
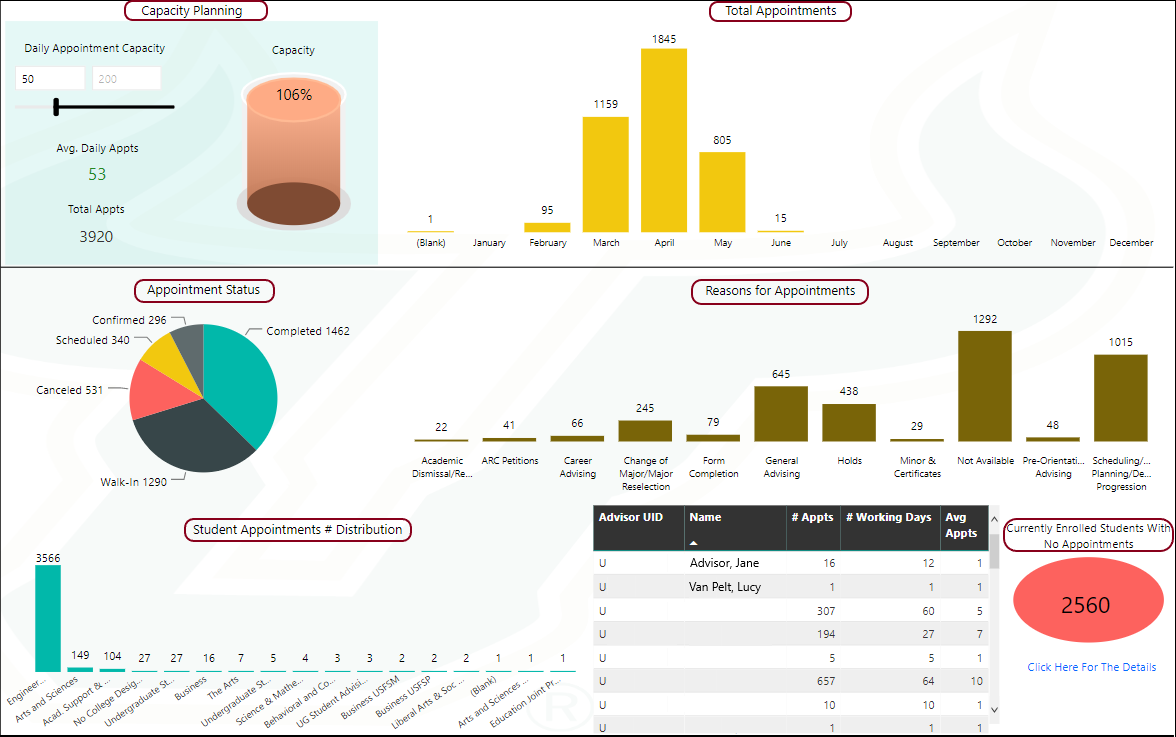
Section 1: Number of Appointments
This section (shaded green above) displays the number of advisor appointments and provides comparisons with the advisor’s college. The statistics show the following:
- Avg Daily Appts: Represents the average daily appointments for the advisor. The basis for this average is the number of days the advisor holds appointments and is not a daily measure.
- Total Appts: Represents the total number of appointments for this advisor.
- Avg. Daily Appts for College: Represents the average daily appointments for advisors in the same college as this advisor. The basis for this average is the following:
- Each advisor's average daily appointments is calculated (number of appointments / number of working days holding appointments).
- The average for the college is then calculated for all advisors in the college (sum of advisor averages / number of advisors).
- Total Appts for College: Represents the number of appointments for all advisors in the same college as this advisor.
For example, Jane Advisor has 74 appointments in March and has nine days on which she held appointments. Her average daily appointment measure is eight. The advisors in her college have a total of 808 appointments for the month. Based on the calculations using the actual days, each of those advisors held these appointments, the average daily appointment count for the college is 11.
Section 2: Appointment Metrics
This section displays three pie charts showing metrics on the advisor/student contact. You can click on any segment of each pie chart to adjust the display of the remaining visuals. For example, if you select “Canceled” in the Appointment Status pie chart, the other visuals display numbers for just the canceled appointments. by "graying out" the remaining selections. This can be helpful, for example, in determining the reasons for the canceled appointments or to see if these appointments fell on particular days of the month. Select “Canceled” again to return to all statuses.
Appointment Status: displays the current status for past and future appointments. Options include:
- Canceled
- Completed
- Confirmed
- Scheduled
- Walk-in
Contact Method: displays how contact is made with the student. Options include:
- Walk-In
- Phone
- Office
- Skype
- Microsoft Teams
- Other
- Not Available
Appointment Outcome: displays the result of the appointment (includes "In Progress" if yet to occur. Options include:
- Walk-In
- In Progress
- Cancelled (Student Canceled - Fault, Student Canceled - No Fault, or SSP Canceled)
- Attended
Section 3: Appointments
This section displays the number of appointments for the advisor by month. If you filter by a date range in the Filter Panel, it displays numbers only for that time period. You can drill down using the “drill” buttons at the top left of this section. Depending on your view, the default selection may display numbers by month.
- Hover over the visual, then click
 to turn on Drill Down.
 - Drill down
 to view the days of the month to show appointments on particular dates in the month.
 - Drill down again to show appointments by hours of the day, such as 7 am or 2 pm.
- Drill up
 to show appointments by year.
You can also drill down to select a specific month and show the distribution among the dates for that month. To do this:
- Click the down arrow to the right
 to turn on Drill Down (Tool Tip: Click to turn on Drill Down).
 - Click the month you wish to view the appointment distribution.
- Optionally click a day to view distribution among hours in the day.
- To exit Drill Down mode, click the down arrow again.
- Drill upto return to the monthly display.
Section 4: Reasons for Appointments
This section lists reasons for the appointments in a bar graph. Each advisor appointment ties to a single reason, based on these selections:
- Academic Dismissal/Reinstatement
- ACR Petitions
- Career Advising
- Change of Major/Major Reselection
- Form Completion
- General Advising
- Holds
- Minor & Certificates
- Not Available
- Pre-Orientation/Transfer Advising
- Scheduling/Course Planning/Degree Progression
As with the other sections, you can click on one component or selection to adjust the data in the other sections for that appointment reason. For example, if you select “Holds,” the other displays adjust to show numbers for appointments set up to discuss registration holds.
Section 5: Appointments by Student
This table displays a list of students with advisor appointments during the date range selected. The number of students in the display changes depending on the filter(s) you select as well as the refinements you make in the bar and pie charts. The table layout displays the following fields:
- Student UID
- Count of Appts
- Date Recent Appt
- Campus
- College
- Department
- Major
- Full Name
You can expand the student listing to a full screen by clicking the “Focus mode” icon. To select this icon, hover over the Appointments by Student section and click the icon on the far right ![]() . Your screen changes to display a full list of the appointments. You can sort by any of the columns in the table by clicking the column label in the Header. To return to the previous display, click “Back to Report” at the top of the screen.
. Your screen changes to display a full list of the appointments. You can sort by any of the columns in the table by clicking the column label in the Header. To return to the previous display, click “Back to Report” at the top of the screen.
Sample Tasks
The following are a few examples of ways you can view the data as well as explore the interactivity among the elements in the display.
Student Appointment Records
You can view a list of students for any of the specific metrics in the Appointments, Appointment Metrics, or Reasons for Appointments sections. For example:
View student names for registration holds:
- Right-click on the Holds bar in the Reasons for Appointments section.
- Select Show data point as a table. The report displays the students requesting advisor appointments for registration holds in table format.
- Select Back to report to return to the dashboard.
View student names for appointments in June:
- Right click on the June bar in the Appointments bar graph.
- Select Show data point as a table. The report displays a list of students having advisor appointments in June.
- Select Back to report to return to the dashboard.
Appointments by Calendar Ranges
You can view appointment data through a month to see if appointment reasons are concentrated on particular days. Note that the default view of the Appointments section shows appointments by month; however, if you save your view of the report, your default setting may be different.
- If desired, select a date range in the Select Date filter.
- Drill the data to the day level by clicking the button in the header of the Appointments (calendar) section.
- Select a particular day of the month to view the reasons for the appointments that day. For example, selecting the 1st of the month may indicate a concentration of scheduling changes. Note that you may have to scroll to view all days.
- Select the day again to return to all appointments.
- Select an appointment reason, such as Holds, in the Reasons for Appointments section to view how concentrated or spread out those appointments are for the month.
Canceled Appointments
You can focus on appointment cancellations using both the metrics in the Data Panel and the filters in the Filter Panel.
- Select “Student Canceled – Fault” in the Appointment Outcome pie chart in the Appointment Metrics section to view the appointments canceled by students.
- View the calendar concentration for the times of the year and times of the month when these cancellations occurred.
- View the reasons the appointments were made to see if there are trends in the types of appointments.
- Finally, open the Appointments by Student listing (click the Focus mode icon) to view a list of these students and identify any students with multiple cancellations.
- To return to the full display, select Back to report, then click the "Student Canceled – Fault" again in the Appointment Outcome field to deselect this option and display all appointments.
Reasons for Appointments
You can view metrics based on selected appointment reasons, such as students changing majors, to view appointment statuses, contact methods, or calendar concentrations.
- For example, select “Change of Major/Major Reselection” in the Reasons for Appointments section.
- View the appointment statuses, the contact methods, and the concentration of this appointment type by month or day.
- Right click the bar for “Change of Major/Major Reselection,” then click Show data point as a table to view the list of the students looking for advisor help in changing majors.
- Select Back to report to return to the dashboard.
Filters
Intelligent Communication#Advisor Name
Intelligent Communication#FIF Cohort
Intelligent Communication#SRKALL Cohort
Intelligent Communication#Select Date
Report Elements
Intelligent Communication#Appointment Status
Intelligent Communication#Appointment Reason
Intelligent Communication#Student UID
Intelligent Communication#Count of Appts
Intelligent Communication#Campus
Intelligent Communication#College
Intelligent Communication#Department
Intelligent Communication#Full Name
Report: IC - Supervisor Summary |
|---|
The IC – Supervisor Summary dashboard provides metrics of advisor appointment data from a supervisor or coordinator viewpoint.
This dashboard provides a summary view of the appointments of all academic advisors; the data can be filtered by college and department. The report has three tabs: Supervisor Summary, Supervisor Details, and Students With No Appts Details. These are described in detail below.
Page 1: Supervisor Summary |
|---|
The dashboard on this tab provides a summary of academic advisor appointments. The dashboard consists of two panels: the left panel allows you to filter the data by elements, such as advisor, college, or cohort; the right panel displays the appointment data in different formats with charts, graphs, and tables.
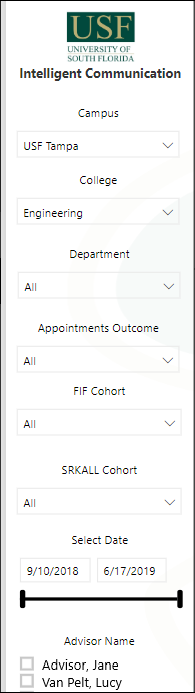
Filter Panel
The panel on the left allows you to filter the data in the data panel. Select to filter by one or more of the following options:

- Campus: Select from the list of campuses.
- College: Select a college to view appointment data for that college; the list is filtered if an advisor is selected.
- Appointment Major: Select the appointment major to view student appointments made with students in that major.
- Appointments Outcome: Select an appointment outcome among the following choices:
- Attended
- No Show
- Not Available
- SSP Canceled
- Student Canceled - Fault
- Student Canceled – No Fault
- Walk-in
- FIF Cohort: Select from the list of available FIF cohorts.
- SRKALL Cohort: Select from the list of available SRKALL cohorts.
- Select Date: Move the slider to select a date range or click in each date field to select from a calendar.
- Advisor Name: Select an advisor name to view appointment data for that advisor; the list is filtered if a college is selected. Note that you can select more than one advisor using the Ctrl key.
Data Panel
The right panel of the dashboard is the main workspace and consists of seven sections. These sections are described in detail below.

Notes:
- The displays for these sections are interactive; that is, if you select a component in one display, the numbers in the other sections adjust accordingly.
- To select an item in a section, click the segment of the pie or bar chart. To return to the full display, click the segment again.
- To view the data in a table in addition to the pie or bar chart, right-click the section title and select Show data.
Section 1: Capacity Planning
This section displays the daily appointment capacity based on the filters you have selected. The default daily appointment capacity is set to 100 and can be adjusted using the slider or by typing in a different value. The maximum capacity is set to 200.
The calculation used to derive the average daily appointments is:
- Each advisor's average daily appointments is calculated (number of appointments / number of working days holding appointments).
- The average for the college is then calculated for all advisors in the college (sum of advisor averages / number of advisors).
Section 2: Appointment Metrics
This section displays three pie charts showing metrics on the advisor/student contact. You can click on any segment of each pie chart to adjust the display of the remaining visuals. For example, if you select “Canceled” in the Appointment Status pie chart, the other visuals display numbers for just the canceled appointments. This can be helpful, for example, in determining the reasons for the canceled appointments or to see if these appointments fell on particular days of the month. Select “Canceled” again to return to all statuses.
Appointment Status: displays the current status for past and future appointments. Options include:
- Canceled
- Completed
- Confirmed
- Scheduled
- Walk-in
Contact Method: displays how contact is made with the student. Options include:
- Walk-In
- Phone
- Office
- Skype
- Microsoft Teams
- Other
- Not Available
Appointment Outcome: displays the result of the appointment (includes "In Progress" if yet to occur. Options include:
- Walk-in
- In Progress
- Cancelled (Student or SSP)
- Attended
Section 3: Total Appointments
This section displays the number of appointments for the selected filters by year, month, day. If you filter by a date range in the Filter Panel, it displays numbers only for that time period. You can drill up and down using the “drill” buttons at the top left of this section. The default selection displays numbers of appointments by month.
- Drill downto show appointments on particular days in the month.
- Drill upto show appointments by year.
Using an additional feature in this section, you can drill down to see the appointments by dates for a particular month. To use this feature,
- Click the down arrow at the top right of the section to turn on Drill Down (Tool Tip: Click to turn on Drill Down).
- Click the month you wish to view the appointment distribution.
- To exit Drill Down mode, click the down arrow again.
- Drill upto return to the monthly display.
Section 4: Reasons for Appointments
This section lists reasons for the advisor appointments in a bar graph. Each advisor appointment has one reason based on these selections:
- Academic Dismissal/Reinstatement
- ACR Petitions
- Career Advising
- Change of Major/Major Reselection
- Form Completion
- General Advising
- Holds
- Minor & Certificates
- Not Available
- Pre-Orientation/Transfer Advising
- Scheduling/Course Planning/Degree Progression
As with the other sections, you can click on one component or selection to adjust the numbers in the other sections for that appointment reason. For example, if you select Holds, the Appointment Status pie chart highlights the appointment status of the appointments set up to discuss registration holds, and the Student Appointments # Distribution section highlights the colleges in which the students reside. Click the Holds segment again to return to the full display.
Section 5: Student Appointments # Distribution
This section displays the number of appointments by college based on the filters selected. The numbers represent the colleges of the students having appointments with advisors. For example, Jane Advisor in Engineering has seen seven students from the College of Engineering, but also two students from Arts and Sciences and one student from Science & Mathematics.
Section 6: Appointments by Advisor (not labeled above)
This table displays a list of advisors, filtered based on your selections in the Filter Panel. This provides information on the number of advisor appointments by advisor as well as the number of working days and averages per working day. You can expand the table by clicking the “Focus mode” icon ![]() at the top right of this section.
at the top right of this section.
The table layout displays the following fields:
- Advisor UID
- Name
- # Appts
- # Working Days
- Avg Appts
You can sort by any of the columns in the table by clicking the column label in the Header. To return to the previous display, click “Back to Report.”
Section 7: Currently Enrolled Students With No Appointments
This section displays the number of students without advisor appointments in the selected college. When you select the Click Here For The Details hyperlink, you move to the Students With No Appts Details page of the report.
Sample Tasks:
The visualizations in this dashboard work best when either a College or College and Advisor are selected. The following are a few examples of ways you can view the data as well as explore the interactivity among the elements in the display.
Advisor Averages by Month
You can view the average number of appointments by advisor for a selected college by viewing the table in the Appointments by Advisor table. Ensure that you have a College selected in the Filter Panel and that you do not have specific advisors selected. The table then lists all advisors in that college with # Appts, # Working Days, and Avg Appts.
You can also narrow this down to averages by month in one of two ways:
- Once a college is selected, filter the date range in the Select Date filter of the Filter Panel.
Alternatively, select a month in the Total Appointments section of the Data Panel. You may have to drill down to view appointments by month. The Appointments by Advisor table adjusts the number of appointments. - Click on the Avg Appts column header in the Appointments by Advisor table. The table lists the advisors’ average daily appointments in descending order. You can expand the table to full screen by hovering over the table, then clicking the Focus mode icon at the top right.
Advisor Appointment Metrics
You can view appointments for a selected college and work with the data to view various metrics for the different advisors within that college:
- Once a College is selected, view the data in the Data Panel.
- In the table, select an advisor to see that advisor’s appointment metrics relative to the college totals.
- Hover over individual segments of the pie charts. The charts display highlighted numbers in a darker shade but retains the numbers for the college.
- Note that the numbers also adjust for this advisor in the Total Appointments, Reasons for Appointments, and Student Appointments # Distribution sections.
- Click the advisor name again to return to the original display.
Filters
Intelligent Communication#Campus
Intelligent Communication#College
Intelligent Communication#FIF Cohort
Intelligent Communication#SRKALL Cohort
Intelligent Communication#Select Date
Intelligent Communication#Advisor Name
Report Elements
Intelligent Communication#Daily Appointment Capacity
Intelligent Communication#Capacity
Intelligent Communication#Appointment Status
Intelligent Communication#Contact Method
Student Appointment Distribution
Intelligent Communication#Advisor UID
Currently Enrolled Students With No Appointments
Page 2: Supervisor Details |
|---|
The report on this tab lists all students in a table format with the Report Elements shown below. You can change the results by selecting filters in the Filter Panel, and you can sort by selecting a column label in the Header row of the table.
Filters
Intelligent Communication#Campus
Intelligent Communication#College
Intelligent Communication#FIF Cohort
Intelligent Communication#SRKALL Cohort
Intelligent Communication#Select Date
Report Elements
Intelligent Communication#Attendee UID
Intelligent Communication#Student Email
Intelligent Communication#Advisor Name
Intelligent Communication#Appointment Type
Intelligent Communication#Contact Method
Intelligent Communication#Appointment Status
Intelligent Communication#Date
Intelligent Communication#FIF Cohort
Page 3: Students With No Appts Details |
|---|
The report displays two tables:
- Currently Enrolled Students With No Appointments: Students on this table do not have a record of an appointment with any advisor.
- Currently Enrolled Students With No Appointments With Home College Advisor: Students listed on this table have a record of an appointment with an advisor in a college other than his/her home college.
The report filters the data based on the selections made in the other tabs. You can sort by selecting a column label in the Header row of the table.
Filters
None
Report Elements
Intelligent Communication#Student UID
Intelligent Communication#First Name
Intelligent Communication#Last Name
Intelligent Communication#College
Intelligent Communication#Department
Report: IC - Drop-In Queue |
|---|
The IC – Drop-In Queue provides a workspace displaying the metrics for the Archivum advising queue used by students who request tele-conference meetings with an advisor (e.g., Teams, phone). Queues are defined by Archivum and data are available to view for one or more queue.
The report provides counts for the number of students in the queue, the number of students who left the queue, and the average wait time for students to connect with an advisor. These counts update when you select filters, such as one or more queues or a specific date range.
To export filtered results to Excel:
- Hover over the table, then click the ellipses in the top right corner of the table display.

The report displays a menu:
- Select Export Data, then work with the data in Excel.
Filter Panel
Intelligent Communication#Queue Name
Intelligent Communication#Advisor Name
Intelligent Communication#Appointment Reason
Report Elements
Intelligent Communication#Students in Queue
Intelligent Communication#Average Wait Time
Intelligent Communication#Student UID
Intelligent Communication#Student College
Intelligent Communication#Drop In
Intelligent Communication#Pick Up
Intelligent Communication#Wait Time (Min)
Intelligent Communication#Advisor Name
Report Elements Glossary Table
The table below lists all of the elements used in the Intelligent Communication reports.
Note: To sort the table elements, click the up or down arrow in the column header.
| Element | Source (System->Table->Column) | Description | Frequency of Update |
|---|---|---|---|
Advisor Appointments | appiandb.AS_appointment ->appointmentid Calculated | The number of appointments for the advisor in the selected date range. | Daily |
Advisor College | appiandb.AS_unitBookingTreeLogic->levelOneDesc | The advisor's home college. | Daily |
| Advisor Email | (SID.HUB_CIMS_CURR_ID_V_Staging -> NETID) + "@usf.edu" | The email address of the advisor. | Daily |
Advisor Name | Crete.FIF_SPRIDEN_Staging -> SPRIDEN_LAST_NAME] + Crete.FIF_SPRIDEN_Staging -> SPRIDEN_FIRST_NAME | The name of the advisor. | Daily |
Advisor UID | appiandb.AS_attendee -> attendeeUId where attendeeTypeRefId = 17 | The advisor's university identification number. | Daily |
Appointment Outcome | appiandb.AS_reference -> displayValue in (Select DISTINCT outcomeRefId) | The result of the advisor appointment. Available values for this field are:
| Daily |
Appointment Reason OR Drop In Reason | appiandb.AS_reference -> displayValue in (Select Distinct reasonRefID) | The reason the student requested the appointment. Available values for this field are:
| Daily |
Appointment Status | appiandb.AS_reference -> displayValue in (Select DISTINCT statusID) | The status of the appointment. Available values for this field are:
The Appointment Status pie chart displays numbers for each of the above appointment statuses based on the filters selected. | Daily |
Appointment Type | appiandb.AS_reference -> displayValue in (typeRefId=1) | Need values (displays in table) | Daily |
# Appts | Count of (appiandb.AS_appointment -> appointmentId) where attendeeTypeRefId = 17 | The total number of appointments for this advisor. | Daily |
Attendee UID | appiandb.AS_attendee -> attendeeUId where attendeeTypeRefId = 16 | The appointment attendee is the student attending the appointment with the advisor. | Daily |
Average Wait Time | Calculated | The average wait time for the filtered results show in minutes. | Daily |
Avg Daily Appts for Advisor | Calculated: AVERAGE(DISTINCTCOUNT (appiandb.AS_appointment -> appointmentId)) per day | The average number of appointments for all advisors per advisor working day in the selected time period. | Daily |
Avg Daily Appts for College | Calculated: | The average number of appointments for advisors within the college. The calculation averages the number of appointments per advisor divided by that advisor's number of working days. | Daily |
Campus | SID.IC_StudentList_Vw -> CampusTitle | The student's or advisor's home campus. | Daily |
Capacity | Calculated | Calculated as a percentage, this value represents the average number of appointments divided by the selected Daily Appointment Capacity target. The Daily Appointment Capacity is set by the user with a maximum of 200. | Daily |
College | SID. IC_StudentList_Vw -> CollegeTitle | The student's home college. | Daily |
Contact Method | appiandb.AS_appointment ->formatRefId in (select DISTINCT formatRefId) | The method used to set up the appointment, such as Phone or Office. | Daily |
Count of Appts | Calculated: DISTINCTCOUNT(appiandb.AS_appointment -> appointmentId) where attendeeTypeRefId = 16 | The number of appointment records for this student. This includes all appointment statuses: Confirmed, Scheduled, Walk-In, Completed, and Canceled. | Daily |
Currently Enrolled Students With No Appointments (count) | count(SID. IC_StudentList_Vw->UID ) + Count(appiandb.AS_attendee -> attendeeUId where attendeeTypeRefId = 16) where Adviser College != Student college | The number of students who are currently enrolled who do not have a record of an advisor appointment. | Daily |
Daily Appointment Capacity | Calculated | The targeted capacity for the number of appointments an advisor holds per day, established by the department and college. The default appointment capacity is set to 100 and can be adjusted by using the slider or by typing in a different value in the field. An upper limit of 200 is hard-coded. | Daily |
Date | Data Refreshed on this date | The date on which data has been loaded. | Daily |
Date Recent Appt | appiandb.AS_appointment -> startDate | This date represents the most recent appointment recorded for the student. | Daily |
Department | appiandb.AS_unitBookingTreeLogic->levelTwoDesc SID. IC_StudentList_Vw -> DepartmentTitle | Department to which the student or advisor belongs. | Daily |
Drop-In | appiandb.AS_v_dropInQueueDetails -> Drop_In | The date and time the student entered the queue. | Daily |
FIF Cohort | Crete.IC_StudentList_Vw.FIFCohort -> | The Finish in Four (FIF) cohort to which the student belongs. | Daily |
First Name | SID.IC_StudentList_VwNAME_FIRST | The first name of the student. | Daily |
Full Name | SID.IC_StudentList_Vw.NAME_LAST + SID.IC_StudentList_VwNAME_FIRST | The full name (first name, last name) of the student. | Daily |
Last Name | SID.IC_StudentList_Vw.NAME_LAST | The last name of the student. | Daily |
Major 1 | SID.IC_StudentList_Vw -> MAJORTITLE | The student's major or primary major if double-majoring. | Daily |
Major 2 | SID.IC_StudentList_Vw -> MAJOR2 | The student's second major, if any. | Daily |
Queue Name | appiandb.AS_v_dropInQueueDetails -> queue_name | The name of the queue the student chose for his or her advisor drop-in appointment. | Daily |
Pick Up | appiandb.AS_v_dropInQueueDetails -> Pick up | The date and time the advisor made the connection with the student for the appointment. | Daily |
Relative Date Options | appiandb.AS_appointment->startDate | Optional method for selecting date ranges in the report. This filter lets you select relative dates, such as Next 2 Months, or Last 1 Year. The filter has three select fields:
| |
Select Date | appiandb.AS_appointment->startDate | The date range of appointments, used to filter the number of appointments to display in the data panel. | Daily |
SRKALL Cohort | SID. IC_StudentList_Vw -> SRKALLCohort | The SRKALL cohort to which a student belongs. | Daily |
Student Appointments # Distribution | DISTINCTCOUNT(IC[appointmentId]) | The distribution of advisor appointments across colleges. | Daily |
Student College | appiandb.AS_v_dropInQueueDetails -> collegedesc | The student's home college | Daily |
Student Email | SID. IC_StudentList_Vw -> GOREMAL_EMAIL_ADDRESS | The student's email address. | Daily |
Student Phone # | appiandb.AS_v_dropInQueueDetails -> phoneNumber | The student's phone number | Daily |
Student UID | appiandb.AS_attendee -> attendeeUId where attendeeTypeRefId = 16 | The student's university identification number. | Daily |
Students in Queue | Calculated | Indicates the number of students who selected a queue to receive a connection with an advisor via Teams or phone. | Daily |
Students Left Queue | Calculated | Indicates the number of students who removed themselves from the queue and did not wait for a connection with the advisor. | Daily |
Total Appts | Calculated: DISTINCTCOUNT(appiandb.AS_appointment -> appointmentId) where attendeeTypeRefId = 17 | The total number of advisor appointments for the selected date range. When selecting more than one advisor on the Supervisor Summary report, this represents a sum of the selected advisors' appointments. | Daily |
Total Appts for College
| Calculated: | The total number of appointments for all advisors in the selected college. | Daily |
Wait Time | Calculated | The number of minutes between the time the student entered the queue to the time the advisor made the connection for the appointment. | Daily |
# Working Days | appiandb.AS_appointment ->startDateTime | Number of days the advisor held advisor appointments. | Daily |
Doc Images |
|||
|---|---|---|---|

|
|
|
|
|
|
|
|
|